A reestruturação da cotonicultura no Brasil - Cepea - USP
A reestruturação da cotonicultura no Brasil - Cepea - USP
A reestruturação da cotonicultura no Brasil - Cepea - USP

Create successful ePaper yourself
Turn your PDF publications into a flip-book with our unique Google optimized e-Paper software.
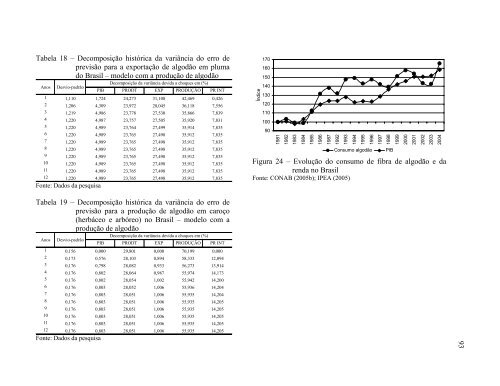
Tabela 18 – Decomposição histórica <strong>da</strong> variância do erro de<br />
previsão para a exportação de algodão em pluma<br />
do <strong>Brasil</strong> – modelo com a produção de algodão<br />
Decomposição <strong>da</strong> variância devi<strong>da</strong> a choques em (%)<br />
A<strong>no</strong>s Desvio-padrão<br />
PIB PRODT EXP PRODUÇÃO PR INT<br />
1 1,110 1,724 24,273 31,108 42,469 0,426<br />
2 1,206 4,309 23,972 28,045 36,118 7,556<br />
3 1,219 4,986 23,778 27,530 35,866 7,839<br />
4 1,220 4,987 23,757 27,505 35,920 7,831<br />
5 1,220 4,989 23,764 27,499 35,914 7,835<br />
6 1,220 4,989 23,765 27,498 35,912 7,835<br />
7 1,220 4,989 23,765 27,498 35,912 7,835<br />
8 1,220 4,989 23,765 27,498 35,912 7,835<br />
9 1,220 4,989 23,765 27,498 35,912 7,835<br />
10 1,220 4,989 23,765 27,498 35,912 7,835<br />
11 1,220 4,989 23,765 27,498 35,912 7,835<br />
12 1,220 4,989 23,765 27,498 35,912 7,835<br />
Fonte: Dados <strong>da</strong> pesquisa<br />
Tabela 19 – Decomposição histórica <strong>da</strong> variância do erro de<br />
previsão para a produção de algodão em caroço<br />
(herbáceo e arbóreo) <strong>no</strong> <strong>Brasil</strong> – modelo com a<br />
produção de algodão<br />
Decomposição <strong>da</strong> variância devi<strong>da</strong> a choques em (%)<br />
A<strong>no</strong>s Desvio-padrão<br />
PIB PRODT EXP PRODUÇÃO PR INT<br />
1 0,156 0,000 29,801 0,000 70,199 0,000<br />
2 0,173 0,576 28,103 0,894 58,333 12,094<br />
3 0,176 0,798 28,082 0,933 56,273 13,914<br />
4 0,176 0,802 28,064 0,987 55,974 14,173<br />
5 0,176 0,802 28,054 1,002 55,942 14,200<br />
6 0,176 0,803 28,052 1,006 55,936 14,204<br />
7 0,176 0,803 28,051 1,006 55,935 14,204<br />
8 0,176 0,803 28,051 1,006 55,935 14,205<br />
9 0,176 0,803 28,051 1,006 55,935 14,205<br />
10 0,176 0,803 28,051 1,006 55,935 14,205<br />
11 0,176 0,803 28,051 1,006 55,935 14,205<br />
12 0,176 0,803 28,051 1,006 55,935 14,205<br />
Fonte: Dados <strong>da</strong> pesquisa<br />
Índice<br />
170<br />
160<br />
150<br />
140<br />
130<br />
120<br />
110<br />
100<br />
90<br />
1981<br />
1982<br />
1983<br />
1984<br />
1985<br />
1986<br />
1987<br />
1992<br />
1993<br />
1994<br />
1995<br />
1996<br />
1997<br />
1998<br />
Consumo algodão PIB<br />
Figura 24 – Evolução do consumo de fibra de algodão e <strong>da</strong><br />
ren<strong>da</strong> <strong>no</strong> <strong>Brasil</strong><br />
Fonte: CONAB (2005b); IPEA (2005)<br />
1999<br />
2000<br />
2001<br />
2002<br />
2003<br />
2004<br />
93