A reestruturação da cotonicultura no Brasil - Cepea - USP
A reestruturação da cotonicultura no Brasil - Cepea - USP
A reestruturação da cotonicultura no Brasil - Cepea - USP

Create successful ePaper yourself
Turn your PDF publications into a flip-book with our unique Google optimized e-Paper software.
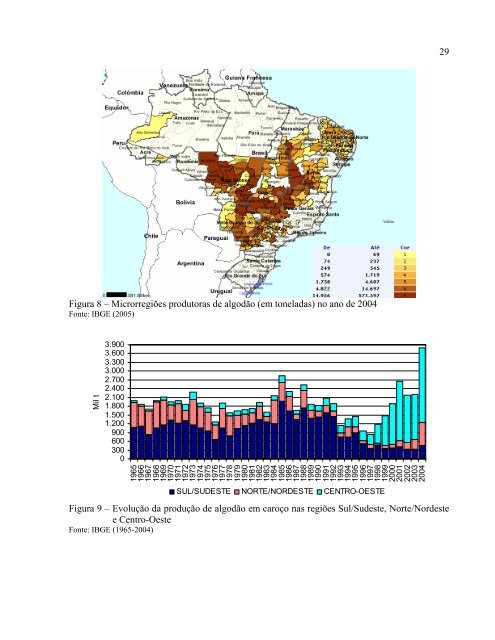
Figura 8 – Microrregiões produtoras de algodão (em tonela<strong>da</strong>s) <strong>no</strong> a<strong>no</strong> de 2004<br />
Fonte: IBGE (2005)<br />
Mil t<br />
3.900<br />
3.600<br />
3.300<br />
3.000<br />
2.700<br />
2.400<br />
2.100<br />
1.800<br />
1.500<br />
1.200<br />
900<br />
600<br />
300<br />
0<br />
1965<br />
1966<br />
1967<br />
1968<br />
1969<br />
1970<br />
1971<br />
1972<br />
1973<br />
1974<br />
1975<br />
1976<br />
1977<br />
1978<br />
1979<br />
1980<br />
1981<br />
1982<br />
1983<br />
1984<br />
1985<br />
1986<br />
1987<br />
1988<br />
1989<br />
1990<br />
1991<br />
1992<br />
1993<br />
1994<br />
1995<br />
1996<br />
1997<br />
1998<br />
1999<br />
2000<br />
2001<br />
2002<br />
2003<br />
2004<br />
SUL/SUDESTE NORTE/NORDESTE CENTRO-OESTE<br />
Figura 9 – Evolução <strong>da</strong> produção de algodão em caroço nas regiões Sul/Sudeste, Norte/Nordeste<br />
e Centro-Oeste<br />
Fonte: IBGE (1965-2004)<br />
29