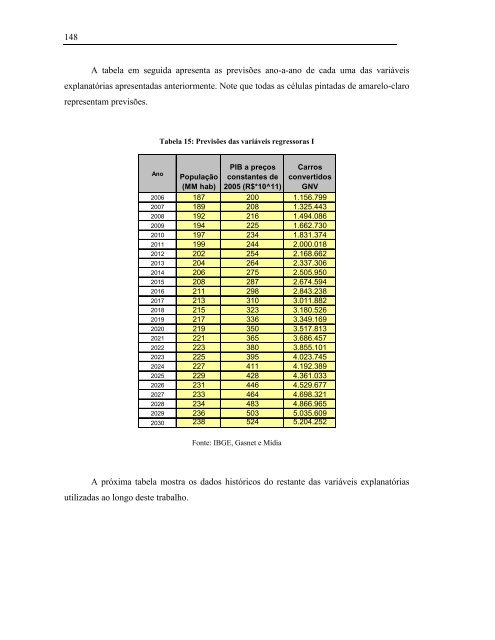
148 A tabela em seguida apresenta as previsões ano-a-ano de cada uma das variáveis explanatórias apresentadas anteriormente. Note que todas as células pintadas de amarelo-claro representam previsões. Ano Tabela 15: Previsões das variáveis regressoras I População (MM hab) PIB a preços constantes de 2005 (R$*10^11) Carros convertidos GNV 2006 187 200 1.156.799 2007 189 208 1.325.443 2008 192 216 1.494.086 2009 194 225 1.662.730 2010 197 234 1.831.374 2011 199 244 2.000.018 2012 202 254 2.168.662 2013 204 264 2.337.306 2014 206 275 2.505.950 2015 208 287 2.674.594 2016 211 298 2.843.238 2017 213 310 3.011.882 2018 215 323 3.180.526 2019 217 336 3.349.169 2020 219 350 3.517.813 2021 221 365 3.686.457 2022 223 380 3.855.101 2023 225 395 4.023.745 2024 227 411 4.192.389 2025 229 428 4.361.033 2026 231 446 4.529.677 2027 233 464 4.698.321 2028 234 483 4.866.965 2029 236 503 5.035.609 2030 238 524 5.204.252 Fonte: IBGE, Gasnet e Mídia A próxima tabela mostra os dados históricos do restante das variáveis explanatórias utilizadas ao longo deste trabalho.
Ano Tabela 16: Dados históricos das variáveis regressoras II Cap. inst total (MW)/100 Cap. inst térmica (MW)/100 Preço relativo GN/óleo comb. 1970 1971 1972 1973 1974 181,33 44,09 1975 209,68 46,52 1976 225,84 46,80 1977 243,39 49,43 1,45 1978 269,72 53,07 1,60 1979 302,19 59,84 1,41 1980 334,72 58,23 1,68 1981 372,69 60,96 1,74 1982 393,46 61,90 1,74 1983 403,66 61,88 1,57 1984 410,96 61,73 1,47 1985 441,07 63,73 1,27 1986 449,53 65,10 1,29 1987 475,61 65,75 1,31 1988 495,75 66,90 1,04 1989 521,25 66,72 0,87 1990 530,50 68,35 1,01 1991 541,41 68,68 0,90 1992 550,49 66,83 0,93 1993 562,22 69,74 0,94 1994 576,29 70,51 1,02 1995 591,20 70,97 0,87 1996 608,01 70,25 0,88 1997 629,72 74,26 0,89 1998 652,09 77,93 0,89 1999 681,81 85,26 0,90 2000 737,12 106,42 0,82 2001 762,55 117,25 0,82 2002 824,58 151,40 0,84 2003 865,05 167,05 0,67 2004 907,33 197,27 0,74 2005 931,58 202,93 0,49 Fonte: Plano Nacional de Expansão 2030 e Balanço Energético Nacional 2006 Em seguida são apresentadas as previsões ano-a-ano das variáveis da tabela acima. 149
- Page 1:
GUSTAVO MODENESI MODELO DE PREVISÃ
- Page 4 and 5:
FICHA CATALOGRÁFICA Modenesi, Gust
- Page 7:
AGRADECIMENTOS Cabem, nesta oportun
- Page 11:
ABSTRACT Natural gas has been incre
- Page 14 and 15:
7.2.1 Energético - Método de Holt
- Page 17 and 18:
LISTA DE GRÁFICOS Gráfico 1: Matr
- Page 19:
Gráfico 50: Previsão da demanda r
- Page 23 and 24:
LISTA DE EQUAÇÕES Equação 1: Co
- Page 25 and 26:
1. Apresentação da empresa do est
- Page 27:
Em 2007 o BCG foi considerado pela
- Page 30 and 31:
26 Por se tratar de uma prática re
- Page 33 and 34:
4. Justificativa O gás natural é
- Page 35 and 36:
Oferta de energia elétrica — His
- Page 37 and 38:
5. O Mercado de Gás Natural 5.1 Pr
- Page 39 and 40:
Oferta nacional de GN crescendo com
- Page 41 and 42:
6. Referencial Teórico 6.1 Visão
- Page 43 and 44:
não sim Definição do problema Co
- Page 45 and 46:
Correlação positiva Correlação
- Page 47 and 48:
Tabela 1: Lag de uma série Observa
- Page 49 and 50:
Figura 5: Decomposição de série
- Page 51 and 52:
Analogamente ao Mean Absolute Error
- Page 53 and 54:
estar “errada”, quando o result
- Page 55 and 56:
Como se pode notar com alguma anál
- Page 57 and 58:
Ou seja, a previsão será uma fun
- Page 59 and 60:
mesmos são automaticamente calcula
- Page 61 and 62:
egression). Por ser o que, de acord
- Page 63 and 64:
Note-se que este método é extrema
- Page 65 and 66:
Fonte: Extraído de Makridakis (199
- Page 67 and 68:
Resultado 120 100 80 60 40 20 0 Dad
- Page 69 and 70:
Equação 22: Single Exponential Sm
- Page 71 and 72:
Esse conjunto de modelos apresenta
- Page 73 and 74:
Vale destacar que diversos modelos
- Page 75 and 76:
Caso perceba-se através do resumo
- Page 77 and 78:
6.4 Utilização dos diferentes mé
- Page 79 and 80:
7. Modelo de previsão de demanda d
- Page 81 and 82:
serem obtidos, Desta forma, nos cas
- Page 83 and 84:
7.1.2 Transportes - Regressão Expl
- Page 85 and 86:
Autocorrelation 1,0 0,8 0,6 0,4 0,2
- Page 87 and 88:
Autocorrelation Autocorrelation Fun
- Page 89 and 90:
MM m 100000 3 MM m /ano 100000 3 /a
- Page 91 and 92:
Tabela 8: Quadro comparativo de mod
- Page 93 and 94:
7.2 Setor Energético A seguir ser
- Page 95 and 96:
Rodando-se uma regressão Stepwise-
- Page 97 and 98:
Analisando a série histórica do p
- Page 99 and 100:
MM m 16000 3 MM m /ano 16000 3 /ano
- Page 101 and 102: 600 500 400 300 200 100 0 0 35 -100
- Page 103 and 104: 300 250 200 150 100 50 -3 0 -50 32
- Page 105 and 106: MM m 14000 3 MM m /ano 14000 3 /ano
- Page 107 and 108: 7.3 Setor Industrial A seguir serã
- Page 109 and 110: 1500 1000 500 -500 -1000 -1500 Equa
- Page 111 and 112: Equação 37: Demanda industrial em
- Page 113 and 114: Autocorrelation 1,0 0,8 0,6 0,4 0,2
- Page 115 and 116: Fazendo-se isso, chega-se à seguin
- Page 117 and 118: Calculou-se o intervalo de confian
- Page 119 and 120: Sendo assim, recomenda-se a utiliza
- Page 121 and 122: Além disso, pode-se, visualmente,
- Page 123 and 124: Autocorrelation 1,0 0,8 0,6 0,4 0,2
- Page 125 and 126: MM m 1800 3 MM m /ano 1800 3 /ano 1
- Page 127 and 128: Equação 44: Demanda residencial e
- Page 129 and 130: MM m 1600 3 MM m /ano 1600 3 /ano 1
- Page 131 and 132: 7.5 Setor Comercial/Público A segu
- Page 133 and 134: macroeconômico brasileiro de grand
- Page 135 and 136: Desta forma, ficamos com a seguinte
- Page 137 and 138: 7.5.3 Setor Comercial/Público - Au
- Page 139 and 140: MM m 3000 3 MM m /ano 3000 3 /ano 2
- Page 141 and 142: Tabela 12: Quadro comparativo de mo
- Page 143 and 144: 7.6 Total Utilizando-se o método d
- Page 145 and 146: 8. Conclusões O objetivo deste tra
- Page 147 and 148: 9. Referências Bibliográficas 143
- Page 149 and 150: 10. Apêndices Nesta seção são a
- Page 151: Sendo assim, a utilização de tais
- Page 155 and 156: MM hab 250 200 150 100 50 0 Popula
- Page 157: 153 futuro desta variável é a de
- Page 160 and 161: 156 Tabela 19: Resultados da previs
- Page 162 and 163: 158 Tabela 21: Resultados da previs
- Page 165: Tabela 23: Resultados da previsão