GUSTAVO MODENESI MODELO DE PREVISÃO DE ... - PRO - USP
GUSTAVO MODENESI MODELO DE PREVISÃO DE ... - PRO - USP
GUSTAVO MODENESI MODELO DE PREVISÃO DE ... - PRO - USP

Create successful ePaper yourself
Turn your PDF publications into a flip-book with our unique Google optimized e-Paper software.
54<br />
dados:<br />
Y<br />
80<br />
70<br />
60<br />
50<br />
40<br />
30<br />
20<br />
10<br />
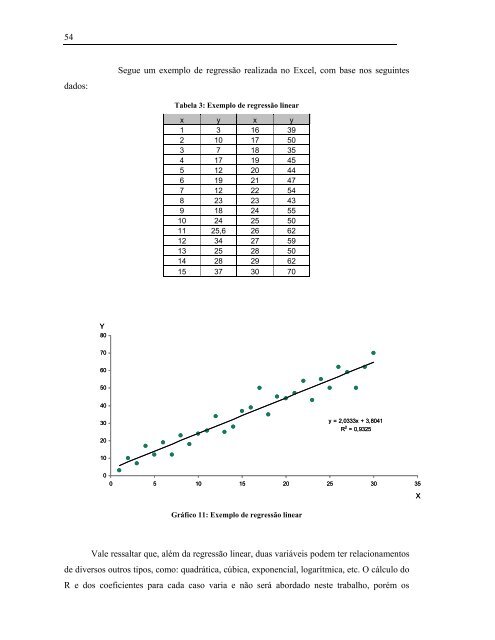
Segue um exemplo de regressão realizada no Excel, com base nos seguintes<br />
Tabela 3: Exemplo de regressão linear<br />
x y x y<br />
1 3 16 39<br />
2 10 17 50<br />
3 7 18 35<br />
4 17 19 45<br />
5 12 20 44<br />
6 19 21 47<br />
7 12 22 54<br />
8 23 23 43<br />
9 18 24 55<br />
10 24 25 50<br />
11 25,6 26 62<br />
12 34 27 59<br />
13 25 28 50<br />
14 28 29 62<br />
15 37 30 70<br />
y = 2,0333x + 3,8041<br />
R 2 y = 2,0333x + 3,8041<br />
R = 0,9325<br />
2 = 0,9325<br />
0<br />
0 5 10 15 20 25 30 35<br />
Gráfico 11: Exemplo de regressão linear<br />
Vale ressaltar que, além da regressão linear, duas variáveis podem ter relacionamentos<br />
de diversos outros tipos, como: quadrática, cúbica, exponencial, logarítmica, etc. O cálculo do<br />
R e dos coeficientes para cada caso varia e não será abordado neste trabalho, porém os<br />
X