150 Ano Tabela 17: Previsões das variáveis regressoras II Cap. inst total (MW)/100 Cap. inst térmica (MW)/100 Preço relativo GN/óleo comb. 2006 964,42 204,63 1,11 2007 997,26 206,34 1,11 2008 1.030,10 208,05 1,11 2009 1.062,95 209,76 1,11 2010 1.095,79 211,46 1,11 2011 1.128,63 213,17 1,11 2012 1.161,47 214,88 1,11 2013 1.194,32 216,59 1,11 2014 1.227,16 218,29 1,11 2015 1.260,00 220,00 1,11 2016 1.304,00 224,00 1,11 2017 1.348,00 228,00 1,11 2018 1.392,00 232,00 1,11 2019 1.436,00 236,00 1,11 2020 1.480,00 240,00 1,11 2021 1.540,00 248,00 1,11 2022 1.600,00 256,00 1,11 2023 1.660,00 264,00 1,11 2024 1.720,00 272,00 1,11 2025 1.780,00 280,00 1,11 2026 1.850,00 298,00 1,11 2027 1.920,00 316,00 1,11 2028 1.990,00 334,00 1,11 2029 2.060,00 352,00 1,11 2030 2.130,00 370,00 1,11 Fonte: Plano Nacional de Expansão 2030 e Balanço Energético Nacional 2006 Abaixo são apresentadas as representações gráficas dos dados das tabelas de variáveis explanatórias. Vale destacar que as representações gráficas dos dados de consumo de gás natural por segmento da demanda foram anteriormente apresentadas no corpo deste mesmo relatório.
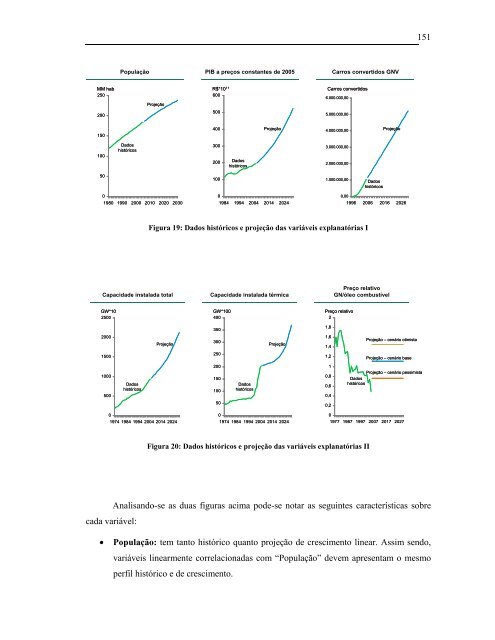
MM hab 250 200 150 100 50 0 População PIB PIB a a preços preços constantes constantes de de 2005 2005 Carros Carros convertidos convertidos GNV GNV Dados históricos Projeção 1980 1990 2000 2010 2020 2030 R$*10 600 11 R$*10 600 11 500 400 300 200 100 0 Dados históricos Projeção 1984 1994 2004 2014 2024 Carros convertidos 6.000.000,00 5.000.000,00 4.000.000,00 3.000.000,00 2.000.000,00 1.000.000,00 Figura 19: Dados históricos e projeção das variáveis explanatórias I Capacidade instalada total Capacidade Capacidade instalada instalada térmica térmica GW*10 2500 2000 1500 1000 500 0 Dados históricos Projeção 1974 1984 1994 2004 2014 2024 GW*100 400 350 300 250 200 150 100 50 0 Dados históricos Projeção 1974 1984 1994 2004 2014 2024 1,8 1,6 1,4 1,2 1 0,8 0,6 0,4 0,2 0 0,00 Dados históricos Projeção 1996 2006 2016 2026 Preço Preço relativo relativo GN/óleo GN/óleo combustível combustível Preço relativo 2 Projeção – cenário otimista Projeção – cenário base Projeção – cenário pessimista Dados históricos 1977 1987 1997 2007 2017 2027 Figura 20: Dados históricos e projeção das variáveis explanatórias II Analisando-se as duas figuras acima pode-se notar as seguintes características sobre cada variável: 151 • População: tem tanto histórico quanto projeção de crescimento linear. Assim sendo, variáveis linearmente correlacionadas com “População” devem apresentam o mesmo perfil histórico e de crescimento.
- Page 1:
GUSTAVO MODENESI MODELO DE PREVISÃ
- Page 4 and 5:
FICHA CATALOGRÁFICA Modenesi, Gust
- Page 7:
AGRADECIMENTOS Cabem, nesta oportun
- Page 11:
ABSTRACT Natural gas has been incre
- Page 14 and 15:
7.2.1 Energético - Método de Holt
- Page 17 and 18:
LISTA DE GRÁFICOS Gráfico 1: Matr
- Page 19:
Gráfico 50: Previsão da demanda r
- Page 23 and 24:
LISTA DE EQUAÇÕES Equação 1: Co
- Page 25 and 26:
1. Apresentação da empresa do est
- Page 27:
Em 2007 o BCG foi considerado pela
- Page 30 and 31:
26 Por se tratar de uma prática re
- Page 33 and 34:
4. Justificativa O gás natural é
- Page 35 and 36:
Oferta de energia elétrica — His
- Page 37 and 38:
5. O Mercado de Gás Natural 5.1 Pr
- Page 39 and 40:
Oferta nacional de GN crescendo com
- Page 41 and 42:
6. Referencial Teórico 6.1 Visão
- Page 43 and 44:
não sim Definição do problema Co
- Page 45 and 46:
Correlação positiva Correlação
- Page 47 and 48:
Tabela 1: Lag de uma série Observa
- Page 49 and 50:
Figura 5: Decomposição de série
- Page 51 and 52:
Analogamente ao Mean Absolute Error
- Page 53 and 54:
estar “errada”, quando o result
- Page 55 and 56:
Como se pode notar com alguma anál
- Page 57 and 58:
Ou seja, a previsão será uma fun
- Page 59 and 60:
mesmos são automaticamente calcula
- Page 61 and 62:
egression). Por ser o que, de acord
- Page 63 and 64:
Note-se que este método é extrema
- Page 65 and 66:
Fonte: Extraído de Makridakis (199
- Page 67 and 68:
Resultado 120 100 80 60 40 20 0 Dad
- Page 69 and 70:
Equação 22: Single Exponential Sm
- Page 71 and 72:
Esse conjunto de modelos apresenta
- Page 73 and 74:
Vale destacar que diversos modelos
- Page 75 and 76:
Caso perceba-se através do resumo
- Page 77 and 78:
6.4 Utilização dos diferentes mé
- Page 79 and 80:
7. Modelo de previsão de demanda d
- Page 81 and 82:
serem obtidos, Desta forma, nos cas
- Page 83 and 84:
7.1.2 Transportes - Regressão Expl
- Page 85 and 86:
Autocorrelation 1,0 0,8 0,6 0,4 0,2
- Page 87 and 88:
Autocorrelation Autocorrelation Fun
- Page 89 and 90:
MM m 100000 3 MM m /ano 100000 3 /a
- Page 91 and 92:
Tabela 8: Quadro comparativo de mod
- Page 93 and 94:
7.2 Setor Energético A seguir ser
- Page 95 and 96:
Rodando-se uma regressão Stepwise-
- Page 97 and 98:
Analisando a série histórica do p
- Page 99 and 100:
MM m 16000 3 MM m /ano 16000 3 /ano
- Page 101 and 102:
600 500 400 300 200 100 0 0 35 -100
- Page 103 and 104: 300 250 200 150 100 50 -3 0 -50 32
- Page 105 and 106: MM m 14000 3 MM m /ano 14000 3 /ano
- Page 107 and 108: 7.3 Setor Industrial A seguir serã
- Page 109 and 110: 1500 1000 500 -500 -1000 -1500 Equa
- Page 111 and 112: Equação 37: Demanda industrial em
- Page 113 and 114: Autocorrelation 1,0 0,8 0,6 0,4 0,2
- Page 115 and 116: Fazendo-se isso, chega-se à seguin
- Page 117 and 118: Calculou-se o intervalo de confian
- Page 119 and 120: Sendo assim, recomenda-se a utiliza
- Page 121 and 122: Além disso, pode-se, visualmente,
- Page 123 and 124: Autocorrelation 1,0 0,8 0,6 0,4 0,2
- Page 125 and 126: MM m 1800 3 MM m /ano 1800 3 /ano 1
- Page 127 and 128: Equação 44: Demanda residencial e
- Page 129 and 130: MM m 1600 3 MM m /ano 1600 3 /ano 1
- Page 131 and 132: 7.5 Setor Comercial/Público A segu
- Page 133 and 134: macroeconômico brasileiro de grand
- Page 135 and 136: Desta forma, ficamos com a seguinte
- Page 137 and 138: 7.5.3 Setor Comercial/Público - Au
- Page 139 and 140: MM m 3000 3 MM m /ano 3000 3 /ano 2
- Page 141 and 142: Tabela 12: Quadro comparativo de mo
- Page 143 and 144: 7.6 Total Utilizando-se o método d
- Page 145 and 146: 8. Conclusões O objetivo deste tra
- Page 147 and 148: 9. Referências Bibliográficas 143
- Page 149 and 150: 10. Apêndices Nesta seção são a
- Page 151 and 152: Sendo assim, a utilização de tais
- Page 153: Ano Tabela 16: Dados históricos da
- Page 157: 153 futuro desta variável é a de
- Page 160 and 161: 156 Tabela 19: Resultados da previs
- Page 162 and 163: 158 Tabela 21: Resultados da previs
- Page 165: Tabela 23: Resultados da previsão