- Page 1: GUSTAVO MODENESI MODELO DE PREVISÃ
- Page 4 and 5: FICHA CATALOGRÁFICA Modenesi, Gust
- Page 7: AGRADECIMENTOS Cabem, nesta oportun
- Page 11: ABSTRACT Natural gas has been incre
- Page 14 and 15: 7.2.1 Energético - Método de Holt
- Page 17 and 18: LISTA DE GRÁFICOS Gráfico 1: Matr
- Page 19: Gráfico 50: Previsão da demanda r
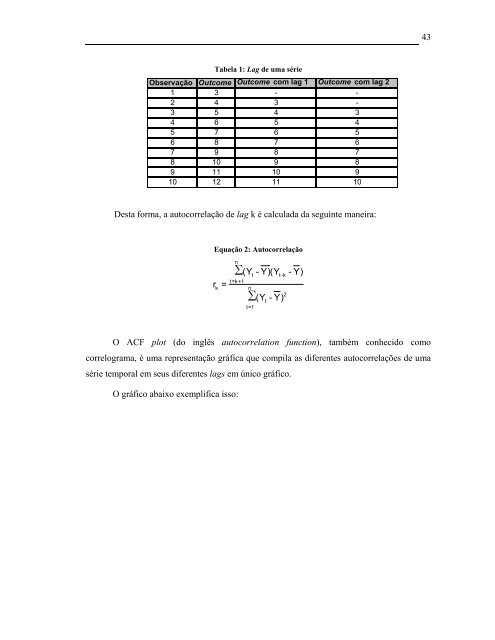
- Page 23 and 24: LISTA DE EQUAÇÕES Equação 1: Co
- Page 25 and 26: 1. Apresentação da empresa do est
- Page 27: Em 2007 o BCG foi considerado pela
- Page 30 and 31: 26 Por se tratar de uma prática re
- Page 33 and 34: 4. Justificativa O gás natural é
- Page 35 and 36: Oferta de energia elétrica — His
- Page 37 and 38: 5. O Mercado de Gás Natural 5.1 Pr
- Page 39 and 40: Oferta nacional de GN crescendo com
- Page 41 and 42: 6. Referencial Teórico 6.1 Visão
- Page 43 and 44: não sim Definição do problema Co
- Page 45: Correlação positiva Correlação
- Page 49 and 50: Figura 5: Decomposição de série
- Page 51 and 52: Analogamente ao Mean Absolute Error
- Page 53 and 54: estar “errada”, quando o result
- Page 55 and 56: Como se pode notar com alguma anál
- Page 57 and 58: Ou seja, a previsão será uma fun
- Page 59 and 60: mesmos são automaticamente calcula
- Page 61 and 62: egression). Por ser o que, de acord
- Page 63 and 64: Note-se que este método é extrema
- Page 65 and 66: Fonte: Extraído de Makridakis (199
- Page 67 and 68: Resultado 120 100 80 60 40 20 0 Dad
- Page 69 and 70: Equação 22: Single Exponential Sm
- Page 71 and 72: Esse conjunto de modelos apresenta
- Page 73 and 74: Vale destacar que diversos modelos
- Page 75 and 76: Caso perceba-se através do resumo
- Page 77 and 78: 6.4 Utilização dos diferentes mé
- Page 79 and 80: 7. Modelo de previsão de demanda d
- Page 81 and 82: serem obtidos, Desta forma, nos cas
- Page 83 and 84: 7.1.2 Transportes - Regressão Expl
- Page 85 and 86: Autocorrelation 1,0 0,8 0,6 0,4 0,2
- Page 87 and 88: Autocorrelation Autocorrelation Fun
- Page 89 and 90: MM m 100000 3 MM m /ano 100000 3 /a
- Page 91 and 92: Tabela 8: Quadro comparativo de mod
- Page 93 and 94: 7.2 Setor Energético A seguir ser
- Page 95 and 96: Rodando-se uma regressão Stepwise-
- Page 97 and 98:
Analisando a série histórica do p
- Page 99 and 100:
MM m 16000 3 MM m /ano 16000 3 /ano
- Page 101 and 102:
600 500 400 300 200 100 0 0 35 -100
- Page 103 and 104:
300 250 200 150 100 50 -3 0 -50 32
- Page 105 and 106:
MM m 14000 3 MM m /ano 14000 3 /ano
- Page 107 and 108:
7.3 Setor Industrial A seguir serã
- Page 109 and 110:
1500 1000 500 -500 -1000 -1500 Equa
- Page 111 and 112:
Equação 37: Demanda industrial em
- Page 113 and 114:
Autocorrelation 1,0 0,8 0,6 0,4 0,2
- Page 115 and 116:
Fazendo-se isso, chega-se à seguin
- Page 117 and 118:
Calculou-se o intervalo de confian
- Page 119 and 120:
Sendo assim, recomenda-se a utiliza
- Page 121 and 122:
Além disso, pode-se, visualmente,
- Page 123 and 124:
Autocorrelation 1,0 0,8 0,6 0,4 0,2
- Page 125 and 126:
MM m 1800 3 MM m /ano 1800 3 /ano 1
- Page 127 and 128:
Equação 44: Demanda residencial e
- Page 129 and 130:
MM m 1600 3 MM m /ano 1600 3 /ano 1
- Page 131 and 132:
7.5 Setor Comercial/Público A segu
- Page 133 and 134:
macroeconômico brasileiro de grand
- Page 135 and 136:
Desta forma, ficamos com a seguinte
- Page 137 and 138:
7.5.3 Setor Comercial/Público - Au
- Page 139 and 140:
MM m 3000 3 MM m /ano 3000 3 /ano 2
- Page 141 and 142:
Tabela 12: Quadro comparativo de mo
- Page 143 and 144:
7.6 Total Utilizando-se o método d
- Page 145 and 146:
8. Conclusões O objetivo deste tra
- Page 147 and 148:
9. Referências Bibliográficas 143
- Page 149 and 150:
10. Apêndices Nesta seção são a
- Page 151 and 152:
Sendo assim, a utilização de tais
- Page 153 and 154:
Ano Tabela 16: Dados históricos da
- Page 155 and 156:
MM hab 250 200 150 100 50 0 Popula
- Page 157:
153 futuro desta variável é a de
- Page 160 and 161:
156 Tabela 19: Resultados da previs
- Page 162 and 163:
158 Tabela 21: Resultados da previs
- Page 165:
Tabela 23: Resultados da previsão