GUSTAVO MODENESI MODELO DE PREVISÃO DE ... - PRO - USP
GUSTAVO MODENESI MODELO DE PREVISÃO DE ... - PRO - USP
GUSTAVO MODENESI MODELO DE PREVISÃO DE ... - PRO - USP

You also want an ePaper? Increase the reach of your titles
YUMPU automatically turns print PDFs into web optimized ePapers that Google loves.
Ano<br />
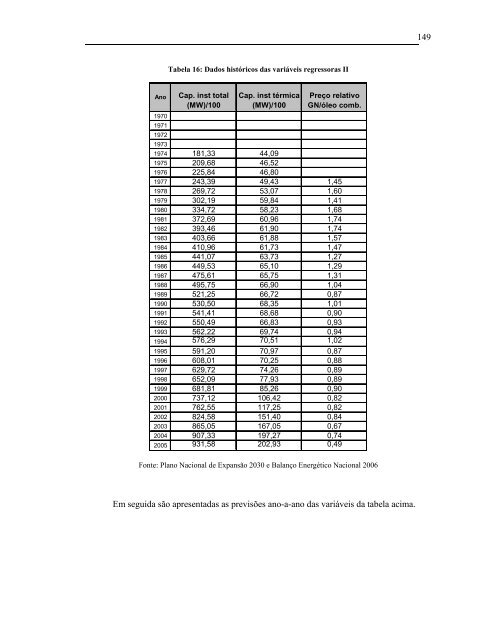
Tabela 16: Dados históricos das variáveis regressoras II<br />
Cap. inst total<br />
(MW)/100<br />
Cap. inst térmica<br />
(MW)/100<br />
Preço relativo<br />
GN/óleo comb.<br />
1970<br />
1971<br />
1972<br />
1973<br />
1974 181,33 44,09<br />
1975 209,68 46,52<br />
1976 225,84 46,80<br />
1977 243,39 49,43 1,45<br />
1978 269,72 53,07 1,60<br />
1979 302,19 59,84 1,41<br />
1980 334,72 58,23 1,68<br />
1981 372,69 60,96 1,74<br />
1982 393,46 61,90 1,74<br />
1983 403,66 61,88 1,57<br />
1984 410,96 61,73 1,47<br />
1985 441,07 63,73 1,27<br />
1986 449,53 65,10 1,29<br />
1987 475,61 65,75 1,31<br />
1988 495,75 66,90 1,04<br />
1989 521,25 66,72 0,87<br />
1990 530,50 68,35 1,01<br />
1991 541,41 68,68 0,90<br />
1992 550,49 66,83 0,93<br />
1993 562,22 69,74 0,94<br />
1994 576,29 70,51 1,02<br />
1995 591,20 70,97 0,87<br />
1996 608,01 70,25 0,88<br />
1997 629,72 74,26 0,89<br />
1998 652,09 77,93 0,89<br />
1999 681,81 85,26 0,90<br />
2000 737,12 106,42 0,82<br />
2001 762,55 117,25 0,82<br />
2002 824,58 151,40 0,84<br />
2003 865,05 167,05 0,67<br />
2004 907,33 197,27 0,74<br />
2005 931,58 202,93 0,49<br />
Fonte: Plano Nacional de Expansão 2030 e Balanço Energético Nacional 2006<br />
Em seguida são apresentadas as previsões ano-a-ano das variáveis da tabela acima.<br />
149