- Page 1 and 2:
TO: Distribution List DRAFT MEMORAN
- Page 3 and 4:
DRAFT on short selling, particularl
- Page 5 and 6:
Price pressure DRAFT Several empiri
- Page 7 and 8:
DRAFT these measures are designed t
- Page 9 and 10:
DRAFT the highly automated markets
- Page 11 and 12:
submitted analyses that are not dir
- Page 13 and 14:
The CFA Institute Centre for Financ
- Page 15 and 16:
DRAFT National Association of Real
- Page 17 and 18:
To: Chairman Christopher Cox Throug
- Page 19 and 20:
In our analyses, (described in furt
- Page 21 and 22:
4. 0< ri 100 bp where bp is basis p
- Page 23 and 24:
We also found that changes in the p
- Page 25 and 26:
- If the order was submitted at the
- Page 27 and 28:
ates were 56%. This asymmetry holds
- Page 29 and 30:
Table 2 - Minimum Shortable Price(M
- Page 31 and 32:
Table 3 Minimum Shortable Price(MSP
- Page 33 and 34:
Table 4 - Minimum Shortable Price(M
- Page 35 and 36:
Table 5 Minimum Shortable Price(MSP
- Page 37 and 38:
Table 5 (cont’d) Minimum Shortabl
- Page 39 and 40:
Table 6 (Cont’d) Minimum Shortabl
- Page 41 and 42:
Table 7-A Stocks: Three sampled sto
- Page 43 and 44:
OFFICE OF ECONOMIC ANALYSIS DRAFT M
- Page 45 and 46:
Historical Context To aid in evalua
- Page 47 and 48:
Market Volatility Forecast The grap
- Page 49 and 50:
Root Mean Squared Return 0.006 0.00
- Page 51 and 52:
Abnormal End-of-Day Volatility In o
- Page 53 and 54:
To further investigate historical p
- Page 55 and 56:
1 0.9 0.8 0.7 0.6 0.5 0.4 0.3 0.2 0
- Page 57 and 58:
Appendix 2: Open-To-Close vs. Overn
- Page 59 and 60:
Appendix 3: Extreme Days The analys
- Page 61 and 62:
Index (15:20 = 1) 1.01 1 0.99 0.98
- Page 63 and 64:
810 800 790 780 770 760 750 740 Fig
- Page 65 and 66:
Have a great week end. Christophe 2
- Page 67 and 68:
Smith, Kathrin From: Bisiere, Chris
- Page 69 and 70:
SEC_OEA_FCIC_001828
- Page 71 and 72:
SEC_OEA_FCIC_001830
- Page 73 and 74:
SEC_OEA_FCIC_001832
- Page 75 and 76:
Smith, Kathrin From: Bisiere, Chris
- Page 77 and 78:
SEC_OEA_FCIC_001836
- Page 79 and 80:
SEC_OEA_FCIC_001838
- Page 81 and 82:
SEC_OEA_FCIC_001840
- Page 83 and 84:
SEC_OEA_FCIC_001842
- Page 85 and 86:
In-Threshold Run Length in Number o
- Page 87 and 88:
Beta Excess Return cond. on # of da
- Page 89 and 90:
Beta Excess Return cond. on # of da
- Page 91 and 92:
Beta Excess Return cond. on # of da
- Page 93 and 94:
Beta Excess Return cond. on in-thre
- Page 95 and 96:
Total Notional Amount (DTCC) Millio
- Page 97 and 98:
Summary of Citigroup Credit Default
- Page 99 and 100:
Summary of Citigroup Credit Default
- Page 101 and 102:
Summary of Citigroup Credit Default
- Page 103 and 104:
Summary of Citigroup Credit Default
- Page 105 and 106:
Total Notional Amount (DTCC) Millio
- Page 107 and 108:
Total Notional Amount (DTCC) Millio
- Page 109 and 110:
Total Notional Amount (DTCC) Millio
- Page 111 and 112:
Total Notional Amount (DTCC) Millio
- Page 113 and 114:
Total Notional Amount (DTCC) Millio
- Page 115 and 116:
Total Notional Amount (DTCC) Millio
- Page 117 and 118:
Total Notional Amount (DTCC) Millio
- Page 119 and 120:
Total Notional Amount (DTCC) Millio
- Page 121 and 122:
Total Notional Amount (DTCC) Millio
- Page 123 and 124:
Total Notional Amount (DTCC) Millio
- Page 125 and 126:
date _NAME_ TD_C AB_C AS_C TM_C 11/
- Page 127 and 128:
ALADDIN R 1 Citigroup Credit Defaul
- Page 129 and 130:
Citigroup Credit Default Swap Trans
- Page 131 and 132:
namegroup idname _NAME_ rangen day_
- Page 133 and 134:
CEDAR HILL CAP 18 bullish bull_18 1
- Page 135 and 136:
GOLDMAN SACHS 35 ssell ssel_35 -10,
- Page 137 and 138:
MERRILL LYNCH 53 bullish bull_53 5,
- Page 139 and 140:
PIM2136 70 ssell ssel_70 PIM2224 71
- Page 141 and 142:
PIM3706 88 bullish bull_88 200,000
- Page 143 and 144:
ROYAL BANK OF 105 ssell ssel_105 -5
- Page 145 and 146:
Summary of Citigroup Credit Default
- Page 147 and 148:
Total Notional Amount (DTCC) Millio
- Page 149 and 150:
Total Notional Amount (DTCC) Millio
- Page 151 and 152:
Total Notional Amount (DTCC) Millio
- Page 153 and 154:
Total Notional Amount (DTCC) Millio
- Page 155 and 156:
Total Notional Amount (DTCC) Millio
- Page 157 and 158:
Total Notional Amount (DTCC) Millio
- Page 159 and 160:
Total Notional Amount (DTCC) Millio
- Page 161 and 162:
Total Notional Amount (DTCC) Millio
- Page 163 and 164:
PIM6888 100 Citigroup Credit Defaul
- Page 165 and 166:
- 91 41 Bearish # - / Bullish # 91
- Page 167 and 168:
BLUE MTN CREDI 12 abuy abuy_12 -20,
- Page 169 and 170:
GENERAL ELECT 34 bearish bear_34 GE
- Page 171 and 172:
NATIONAL BANK O 56 cnet cnet_56 0 -
- Page 173 and 174:
PIM2679 78 sbuy sbuy_78 PIM2679 78
- Page 175 and 176:
PROVINZIAL RHE 101 abuy abuy_101 PR
- Page 177 and 178:
Summary of Citigroup Credit Default
- Page 179 and 180:
Price $15.00 $12.50 $10.00 $7.50 $5
- Page 181 and 182:
21 18 COL1 3.807082 3.54 4.04 0.5 3
- Page 183 and 184:
Total Notional Amount (DTCC) Millio
- Page 185 and 186:
Summary of Citigroup Credit Default
- Page 187 and 188:
Summary of Citigroup Credit Default
- Page 189 and 190:
Summary of Citigroup Credit Default
- Page 191 and 192:
Summary of Citigroup Credit Default
- Page 193 and 194:
Total Notional Amount (DTCC) Millio
- Page 195 and 196:
Total Notional Amount (DTCC) Millio
- Page 197 and 198:
Total Notional Amount (DTCC) Millio
- Page 199 and 200:
Total Notional Amount (DTCC) Millio
- Page 201 and 202:
Total Notional Amount (DTCC) Millio
- Page 203 and 204:
Date Open High Low Close Volume Adj
- Page 205 and 206:
date2 _NAME_2 no_NoPay_C fi_NoPay_C
- Page 207 and 208:
PIM6888 100 Citigroup Credit Defaul
- Page 209 and 210:
- 91 41 Bearish # - / Bullish # 91
- Page 211 and 212:
BLACK DIAMOND OFFSHORE, LTD 11 abuy
- Page 213 and 214:
FORE ERISA FUND, LTD. 31 bearish be
- Page 215 and 216:
MARATHON 51 cnet cnet_51 0 0 -45,00
- Page 217 and 218:
PIM2224 71 sbuy sbuy_71 1,000,000 P
- Page 219 and 220:
PIM4807 92 abuy abuy_92 PIM4807 92
- Page 221 and 222:
THE ROYAL BANK OF SCOTLAND PLC 112
- Page 223 and 224:
11/18/08 -17000000 10000000 -7,000,
- Page 225 and 226:
Summary of Citigroup Credit Default
- Page 227 and 228:
Adjusted Close 25 20 15 10 5 0 10/1
- Page 229 and 230:
Summary of Citigroup Credit Default
- Page 231 and 232:
Summary of Citigroup Credit Default
- Page 233 and 234:
Summary of Citigroup Credit Default
- Page 235 and 236:
Summary of Citigroup Credit Default
- Page 237 and 238:
BBVA DerivServ SUBMITTING_PARTY SUB
- Page 239 and 240:
BUYER_NAME SELLER_ID SELLER_NAME TR
- Page 241 and 242:
SUBMIT_DATE SUBMIT_TIME TRANSACTION
- Page 243 and 244:
NOTIONAL_AMOUNT NOTIONAL_CURRENCY A
- Page 245 and 246:
POST_TRADE_PAYMENT_DATE POST_TRADE_
- Page 247 and 248:
PERIOD_MULTIPLIER PAYMENT_FREQUENCY
- Page 249 and 250:
INITIAL_CURRENCY RESTRUCTING_INDICA
- Page 251 and 252:
MATRIX_TYPE PUBLICATION_DATE 01/01/
- Page 253 and 254:
MATRIX_AGREEMENT_DATE ASSIGNMENT_RO
- Page 255 and 256:
Total Notional Amount (DTCC) Millio
- Page 257 and 258:
Total Notional Amount (DTCC) Millio
- Page 259 and 260:
Total Notional Amount (DTCC) Millio
- Page 261 and 262:
Total Notional Amount (DTCC) Millio
- Page 263 and 264:
Total Notional Amount (DTCC) Millio
- Page 265 and 266:
Total Notional Amount (DTCC) Millio
- Page 267 and 268:
Total Notional Amount (DTCC) Millio
- Page 269 and 270:
date _NAME_ TD_C AB_C AS_C TM_C 11/
- Page 271 and 272:
ALADDIN R 1 Citigroup Credit Defaul
- Page 273 and 274:
Citigroup Credit Default Swap Trans
- Page 275 and 276:
namegroup idname _NAME_ rangen day_
- Page 277 and 278:
CREDIT SUISSE INTERNATIONAL 21 abuy
- Page 279 and 280:
INTERN KAPIT MBH (PRV-C) 41 bearish
- Page 281 and 282:
PIM1356 61 cnet cnet_61 500,000 500
- Page 283 and 284:
PIM2755 81 sbuy sbuy_81 300,000 PIM
- Page 285 and 286:
PURSUIT 102 abuy abuy_102 PURSUIT 1
- Page 287 and 288:
BNP Paribas Securities Corp. Top No
- Page 289 and 290:
Summary of Citigroup Credit Default
- Page 291 and 292:
Volume (thousands) 1 , 1 0 0 1 , 0
- Page 293 and 294:
Volume (thousands) 3 , 0 0 0 2 , 0
- Page 295 and 296:
Volume (thousands) 7 , 0 0 0 6 , 0
- Page 297 and 298:
Volume (thousands) Price and Volume
- Page 299 and 300:
Volume (thousands) Price and Volume
- Page 301 and 302:
Volume (thousands) 1 , 1 0 0 1 , 0
- Page 303 and 304:
Volume (thousands) 4 , 0 0 0 3 , 0
- Page 305 and 306:
Volume (thousands) 3 0 2 0 1 0 0 Pr
- Page 307 and 308:
security on each calendar day of th
- Page 309 and 310:
10. Percentage of short positions c
- Page 311 and 312:
selling. The purple bar indicates t
- Page 313 and 314:
Chart 1 Form SH Daily Volume Compar
- Page 315 and 316:
Form SH Reported Short Volume for C
- Page 317 and 318:
Form SH Data Quality Check of Volum
- Page 319 and 320:
Form SH Summary of Securities by CR
- Page 321 and 322:
# of Securities (3,989 Total) 1,600
- Page 323 and 324:
# Security - Days (3,899 Total) 600
- Page 325 and 326:
Form SH Reported Data Compared to O
- Page 327 and 328:
# Daily Positions 300,000 250,000 2
- Page 329 and 330:
# Daily Volumes 45,000 40,000 35,00
- Page 331 and 332:
Securities Reported by Filers 30,00
- Page 333 and 334:
Dollar Value Sold Short ($ Millions
- Page 335 and 336:
# of Security Days with Some Report
- Page 337 and 338:
# of Security Days with Significant
- Page 339 and 340:
Price $0.20 $0.19 $0.18 $0.17 $0.16
- Page 341 and 342:
Price $3.00 $2.50 $2.00 $1.50 $1.00
- Page 343 and 344:
Price $17.50 $17.00 $16.50 $16.00 $
- Page 345 and 346:
Price $50.00 $45.00 $40.00 $35.00 $
- Page 347 and 348:
Price $2.40 $2.35 $2.30 $2.25 $2.20
- Page 349 and 350:
Price $16.00 $14.00 $12.00 $10.00 $
- Page 351 and 352:
dayn trade_date COMNAM PERMNO SHRCD
- Page 353 and 354:
14 14-Nov-08 HONEYWE 10145 11 20.16
- Page 355 and 356:
14 14-Nov-08 STURM RU 73219 11 0.00
- Page 357 and 358:
14 14-Nov-08 G A T X CO 12036 11 0.
- Page 359 and 360:
14 14-Nov-08 MAGUIRE 89768 18 35.07
- Page 361 and 362:
14 14-Nov-08 EMERITUS 82638 11 0.32
- Page 363 and 364:
14 14-Nov-08 GRAY TEL 83989 11 76.5
- Page 365 and 366:
14 14-Nov-08 CYTEC IND 80079 11 1.5
- Page 367 and 368:
14 14-Nov-08 TEXTAINE 92379 12 1.02
- Page 369 and 370:
14 14-Nov-08 CONSOL E 86799 11 3.04
- Page 371 and 372:
28 ######## DORAL FIN 12169 11 0.00
- Page 373 and 374:
volp_b _TYPE_ _FREQ_ countvolp volp
- Page 375 and 376:
shortpct ndays ndays_downdays_flat
- Page 377 and 378:
ndays_nex ndays_nex COMNAM 1 1 RITC
- Page 379 and 380:
PERMNO trade_date sdevv vol_crsp vo
- Page 381 and 382:
trade_date _NAME_ PRC_1 prc_down_ p
- Page 383 and 384:
vol_rest_7 PRC_10 prc_down_ prc_up_
- Page 385 and 386:
TY ENTERPRISES INC Y CO E BRANDS IN
- Page 387 and 388:
17 0 191 191 17 18 0 154 154 18 19
- Page 389 and 390:
nfilers_hist count low high lab1 _T
- Page 391 and 392:
date day_week count count_vol count
- Page 393 and 394:
Price $46.00 $45.00 $44.00 $43.00 $
- Page 395 and 396:
Price $46.00 $45.00 $44.00 $43.00 $
- Page 397 and 398:
Price $46.00 $45.00 $44.00 $43.00 $
- Page 399 and 400:
Price $46.00 $45.00 $44.00 $43.00 $
- Page 401 and 402:
Price $40.00 $35.00 $30.00 $25.00 $
- Page 403 and 404:
Price $40.00 $35.00 $30.00 $25.00 $
- Page 405 and 406:
Price $40.00 $35.00 $30.00 $25.00 $
- Page 407 and 408:
Symbol hour minute sort trend5_2 tr
- Page 409 and 410:
MS 17 43 0 MS 17 44 0 MS 17 45 0 MS
- Page 411 and 412:
MS 8 27 1 MS 8 28 1 MS 8 29 1 MS 8
- Page 413 and 414:
MS 10 11 1 MS 10 12 1 MS 10 13 1 MS
- Page 415 and 416:
MS 11 55 1 MS 11 56 1 MS 11 57 1 MS
- Page 417 and 418:
MS 13 39 1 MS 13 40 1 MS 13 41 1 MS
- Page 419 and 420:
MS 15 23 1 MS 15 24 1 MS 15 25 1 MS
- Page 421 and 422:
HBB HBB HBB HBB HBB HBB HBB HBB HBB
- Page 423 and 424:
HBB LBB HBB LBB HBB LBB HBB LBB HBB
- Page 425 and 426:
LBB LBB LBB LBB LBB LBB
- Page 427 and 428:
HBB HBB HBB HBB HBB HBB HBB HBB HBB
- Page 429 and 430:
118679 140734 81539 98153 119580 10
- Page 431 and 432:
549976 740793 730713 530553 633869
- Page 433 and 434:
241120 221885 463089 242404 268242
- Page 435 and 436:
1034773 507119 1929040 729702 21777
- Page 437 and 438:
down5_8 down5_9 down5_10 down5_11 d
- Page 439 and 440:
594851 477540 815219 558737 595063
- Page 441 and 442:
533491 248814 375456 321906 302504
- Page 443 and 444:
624651 1105941 805570 1053176 11970
- Page 445 and 446:
4200 37163 300 200 7379 500 700 100
- Page 447 and 448:
100 100 1501 600 621 330 4000 1200
- Page 449 and 450:
100 600 500 5500 100 200 1200 3800
- Page 451 and 452:
20910 36164 30643 155502 74702 1124
- Page 453 and 454:
34196 19500 55548 30203 29025 49981
- Page 455 and 456:
33038 9300 33512 28113 24513 31940
- Page 457 and 458:
trade_12 trade_15 trade_16 trade_17
- Page 459 and 460:
3259 4060 1301 3600 6100 410 3800 1
- Page 461 and 462:
245 23292 29685 32235 131277 50646
- Page 463 and 464:
94506 158205 426920 1103544 257455
- Page 465 and 466:
16200 110995 231657 425131 597896 4
- Page 467 and 468:
37430 109134 110898 474335 769341 7
- Page 469 and 470:
53417 181823 546172 342284 49297 19
- Page 471 and 472:
MS 16 49 MS 16 50 MS 16 51 MS 16 52
- Page 473 and 474:
MS 18 33 MS 18 34 MS 18 35 MS 18 36
- Page 475 and 476:
MS 9 17 MS 9 18 MS 9 19 MS 9 20 MS
- Page 477 and 478:
MS 11 1 MS 11 2 MS 11 3 MS 11 4 MS
- Page 479 and 480:
MS 12 45 MS 12 46 MS 12 47 MS 12 48
- Page 481 and 482:
MS 14 29 MS 14 30 MS 14 31 MS 14 32
- Page 483 and 484:
spindex__ meanp_2 minp_2 maxp_2 ran
- Page 485 and 486:
41.16
- Page 487 and 488:
41.46327 41.45829 41.46125 41.46493
- Page 489 and 490:
42.14067 42.1 42.23 0.13 0 35200 41
- Page 491 and 492:
42.04836 42 42.1 0.1 0 24500 41.392
- Page 493 and 494:
41.39925 41.39 41.42 0.03 0 24442 4
- Page 495 and 496:
40.86447 40.82 40.88 0.06 0 28120 4
- Page 497 and 498:
41.3 41.3 0 13055 0 41.2573 41.2701
- Page 499 and 500:
41.052 41.06055 41.04888 41.1732 41
- Page 501 and 502:
41.18338 41.19231 41.19168 41.19479
- Page 503 and 504:
41.73 41.82 0.09 0 22423 41.24243 4
- Page 505 and 506:
41.49 41.54 0.05 0 13778 40.99331 4
- Page 507 and 508:
41.45 41.48 0.03 0 15300 41.02212 4
- Page 509 and 510:
angep_4 tradebig_4 tradesmall_spind
- Page 511 and 512:
42.18422 42.18422 42.18272 0 0 100
- Page 513 and 514:
41.97166 41.96509 41.98361 41.98375
- Page 515 and 516:
0.1289 12200 82640 41.8887 40.12155
- Page 517 and 518:
0.09 0 21945 41.41648 40.53181 40.4
- Page 519 and 520:
0.08 0 51100 41.11773 41.09831 41.0
- Page 521 and 522:
0.1 0 43500 41.07753 40.66593 40.64
- Page 523 and 524:
40.35161 41.72151 40.34821 41.72793
- Page 525 and 526:
100 40.23214 44.32539 44.3 44.51 0.
- Page 527 and 528:
40.04062 44.11875 44.1 44.15 0.05 0
- Page 529 and 530:
37530 39.78727 41.9703 41.88 42.08
- Page 531 and 532:
17590 40.17506 42.82236 42.77 42.86
- Page 533 and 534:
23962 40.35303 42.48832 42.45 42.55
- Page 535 and 536:
meanp_9 minp_9 maxp_9 rangep_9 trad
- Page 537 and 538:
43.18457 43.18117 43.19477 43.18627
- Page 539 and 540:
43.36903 43.37727 39.7425 39.74 43.
- Page 541 and 542:
42.95786 42.87 43 0.13 0 70242 43.1
- Page 543 and 544:
42.17411 42.14 42.24 0.1 0 90289 42
- Page 545 and 546:
41.78421 41.74 41.84 0.1 0 26343 42
- Page 547 and 548:
40.50608 40.45 40.55 0.1 0 34709 42
- Page 549 and 550:
40.4893 40.45867 40.4 0 41937 0 40.
- Page 551 and 552:
40 0.05 0 600 40.50209 37.71002 37.
- Page 553 and 554:
39.94 0.13 0 2192 40.67039 35.91425
- Page 555 and 556:
38.32 0.14 0 111093 40.37693 37.312
- Page 557 and 558:
39.02 0.08 0 34460 40.69035 37.5625
- Page 559 and 560:
40.07 0.05 0 21911 40.88056 38.7236
- Page 561 and 562:
tradebig_11tradesmall_spindex_11mea
- Page 563 and 564:
39.07 39.07 39.07 0 0 100 39.05293
- Page 565 and 566:
0 1500 38.43361 0 500 38.39862 38.2
- Page 567 and 568:
0 208240 38.53788 37.8859 37.84 37.
- Page 569 and 570:
0 119996 38.95339 39.13122 39.06 39
- Page 571 and 572:
0 44256 38.79547 37.98676 37.94 38.
- Page 573 and 574:
0 110077 39.01476 38.22831 38.21 38
- Page 575 and 576:
38.70023 37.3634 38.72405 37.23349
- Page 577 and 578:
38.55764 34.03986 33.9 34.5 0.6 0 8
- Page 579 and 580:
38.32867 32.99608 32.99 33.01 0.02
- Page 581 and 582:
38.63587 34.58665 34.56 34.66 0.1 4
- Page 583 and 584:
38.56625 33.82328 33.76 33.88 0.12
- Page 585 and 586:
38.54373 32.38956 32.27 32.5 0.23 0
- Page 587 and 588:
minp_16 maxp_16 rangep_16 tradebig_
- Page 589 and 590:
32.13448 31.78 31.78 0 0 200 32.134
- Page 591 and 592:
27.86 28.24 0.38 0 60290 31.67596 2
- Page 593 and 594:
28.025 28.75 0.725 59400 618974 31.
- Page 595 and 596:
26.42 26.78 0.36 0 182872 31.98663
- Page 597 and 598:
27.83 27.995 0.165 0 85468 32.13794
- Page 599 and 600:
28.42 28.8 0.38 40100 308589 32.558
- Page 601 and 602:
0.38 0 7875 28.54326 22.66857 22.58
- Page 603 and 604:
0.4 0 37836 28.72396 22.84878 22.55
- Page 605 and 606:
0.46 23416 91786 28.11341 20.14171
- Page 607 and 608:
0.29 0 408554 27.96835 19.59765 19.
- Page 609 and 610:
0.225 0 494911 27.84082 15.32434 14
- Page 611 and 612:
0.56 145997 1370219 27.91591 17.442
- Page 613 and 614:
tradesmall_spindex_18meanp_19 minp_
- Page 615 and 616:
2900 21.79807 22.57521 7500 22.7348
- Page 617 and 618:
59616 21.91836 32.85777 32.69 33 0.
- Page 619 and 620:
813439 22.14338 25.76577 24.85 26.7
- Page 621 and 622:
463989 21.6108 28.04861 27.99 28.12
- Page 623 and 624:
439396 21.88219 28.96691 28.85 29.0
- Page 625 and 626:
1307381 22.45974 25.50933 25.1388 2
- Page 627 and 628:
27.09373 0 26.89034 26.75 26.9 0.15
- Page 629 and 630:
0 0 0 0 0 0 0 0 0 0 0 0 0 0 0 0 0 0
- Page 631 and 632:
1 1 1 1 1 1 1 1 1 1 1 1 1 1 1 1 1 1
- Page 633 and 634:
1 1 1 1 1 1 1 1 1 1 1 1 1 1 1 1 1 1
- Page 635 and 636:
1 1 1 1 1 1 1 1 1 1 1 1 1 1 1 1 1:0
- Page 637 and 638:
1 1 1 1 1 1 1 1 1 1 1 1 1 1 1 1 1 1
- Page 639:
verticle close_1 close_2 close_3 cl
- Page 643 and 644:
40.83 41.3 42.17 40.34 41.36 43.27
- Page 645 and 646:
50 51 52 53 54 55 56 57 58 59 60 61
- Page 647 and 648:
154 155 156 157 158 159 160 161 162
- Page 649 and 650:
258 259 260 261 262 263 264 265 266
- Page 651 and 652:
362 363 364 365 366 367 368 369 370
- Page 653 and 654:
466 467 468 469 470 471 472 473 474
- Page 655 and 656:
570 571 572 573 574 575 576 577 578
- Page 657 and 658:
Morgan Stanley Intraday Trading by
- Page 659 and 660:
Goldman Sachs September Activity Ja
- Page 661 and 662:
Trading Patterns of Interest • Tr
- Page 663 and 664:
Goldman Sachs Stock Price Summary P
- Page 665 and 666:
Goldman Sachs Intra-Day Stock Price
- Page 667 and 668:
Goldman Sachs Intra-Day Stock Price
- Page 669 and 670:
Goldman Sachs 21(a) Response - Exam
- Page 671 and 672:
Goldman Sachs 21(a) Response - Exam
- Page 673 and 674:
Morgan Stanley CDS Summary (Goldman
- Page 675 and 676:
Morgan Stanley CDS Transactions (Go
- Page 677 and 678:
Example 6: CDS (Using Morgan Stanle
- Page 679 and 680:
Goldman Sachs Example 8a: Assent St
- Page 681 and 682:
Goldman Sachs Example 8c: Assent St
- Page 683 and 684:
Summary File Common Stock Transacti
- Page 685 and 686:
Confidential 45 Wellington Capital
- Page 687 and 688:
OEA DRAFT - INTERNAL Therefore, exa
- Page 689 and 690:
Figure 2 Percent of Shares Outstand
- Page 691 and 692:
Figure 4 Percent of Shares Outstand
- Page 693 and 694:
Figure 6 Percent of Shares Outstand
- Page 695 and 696:
Figure 8 Percent of Shares Outstand
- Page 697 and 698:
Merrill Lynch September Activity Ja
- Page 699 and 700:
Trading Patterns of Interest • Tr
- Page 701 and 702:
Merrill Lynch Stock Price Summary P
- Page 703 and 704:
Merrill Lynch Intra-Day Stock Price
- Page 705 and 706:
Merrill Lynch Intra-Day Stock Price
- Page 707 and 708:
Merrill Lynch CDS Prices of New Tra
- Page 709 and 710:
Merrill Lynch CDS Transactions Top
- Page 711 and 712:
Merrill Lynch 21(a) Response - Exam
- Page 713 and 714:
Merrill Lynch 21(a) Response - Exam
- Page 715 and 716:
Merrill Lynch 21(a) Response - Exam
- Page 717 and 718:
Merrill Lynch Example 7a: Assent St
- Page 719 and 720:
Merrill Lynch Example 7c: Assent St
- Page 721 and 722:
Summary File Common Stock Transacti
- Page 723 and 724:
Morgan Stanley Stock Price Summary
- Page 725 and 726:
Morgan Stanley Intra-Day Stock Pric
- Page 727 and 728:
Morgan Stanley CDS Summary SEC_OEA_
- Page 729 and 730:
Morgan Stanley 21(a) Response - Exa
- Page 731 and 732:
Morgan Stanley 21(a) Response - Exa
- Page 733 and 734:
Morgan Stanley 21(a) Response - Exa
- Page 735 and 736:
Morgan Stanley 21(a) Response - Exa
- Page 737 and 738:
Summary File Common Stock Transacti
- Page 739 and 740:
Morgan Stanley September Activity J
- Page 741 and 742:
Trading Patterns of Interest • Tr
- Page 743 and 744:
Morgan Stanley Stock Price Summary
- Page 745 and 746:
Morgan Stanley Intra-Day Stock Pric
- Page 747 and 748:
Morgan Stanley Intra-Day Stock Pric
- Page 749 and 750:
Morgan Stanley CDS Prices of New Tr
- Page 751 and 752:
Morgan Stanley CDS Transactions Top
- Page 753 and 754:
Morgan Stanley Example 1b: CDS Cita
- Page 755 and 756:
Morgan Stanley Example 2b: CDS Paul
- Page 757 and 758:
Morgan Stanley Example 3b: CDS Deut
- Page 759 and 760:
Morgan Stanley Example 4b: CDS Merr
- Page 761 and 762:
Morgan Stanley Example 5b: Assent S
- Page 763 and 764:
Summary File Common Stock Transacti
- Page 765 and 766:
Washington Mutual September Activit
- Page 767 and 768:
Trading Patterns of Interest • Tr
- Page 769 and 770:
Washington Mutual Stock Price Summa
- Page 771 and 772:
Washington Mutual Intra-Day Stock P
- Page 773 and 774:
Washington Mutual Intra-Day Stock P
- Page 775 and 776:
Washington Mutual CDS Prices of New
- Page 777 and 778:
Washington Mutual CDS Transactions
- Page 779 and 780:
Washington Mutual 21(a) Response -
- Page 781 and 782:
Washington Mutual 21(a) Response -
- Page 783 and 784:
Washington Mutual 21(a) Response -
- Page 785 and 786:
Washington Mutual Example 7a: Assen
- Page 787 and 788:
Washington Mutual Example 7c: Assen
- Page 789 and 790:
Summary File Common Stock Transacti
- Page 791 and 792:
Form 424B2 NATIONAL CITY CORP - ncc
- Page 793 and 794:
2013 at a redemption price per shar
- Page 795 and 796:
Table of Contents ABOUT THIS PROSPE
- Page 797 and 798:
Table of Contents SUMMARY This summ
- Page 799:
Table of Contents Dividend Stopper
- Page 802 and 803:
S-4
- Page 804 and 805:
Table of Contents RISK FACTORS An i
- Page 806 and 807:
Table of Contents decline as a resu
- Page 808 and 809:
Table of Contents USE OF PROCEEDS W
- Page 810 and 811:
Table of Contents upon the conversi
- Page 812 and 813:
Table of Contents number of shares
- Page 814 and 815:
Table of Contents not to issue such
- Page 816 and 817:
Table of Contents adjustments to th
- Page 818 and 819:
Table of Contents to authorize, or
- Page 820 and 821:
Table of Contents exercised by the
- Page 822 and 823:
Table of Contents DIRECT REGISTRATI
- Page 824 and 825:
Table of Contents of a partnership
- Page 826 and 827:
Table of Contents in an amount equa
- Page 828 and 829:
Table of Contents Information Repor
- Page 830 and 831:
Table of Contents Plan, or any pers
- Page 832 and 833:
Table of Contents Shares of Series
- Page 834 and 835:
Table of Contents Maximum Number of
- Page 837 and 838:
Table of Contents Shares of Series
- Page 839 and 840:
Table of Contents Shares of Series
- Page 841 and 842:
Table of Contents (1) The “Maximu
- Page 843 and 844:
Table of Contents natural persons t
- Page 845:
Table of Contents Because the selli
- Page 848 and 849:
Table of Contents PLAN OF DISTRIBUT
- Page 850 and 851:
Table of Contents PROSPECTUS Senior
- Page 852 and 853:
Table of Contents ABOUT THIS PROSPE
- Page 854 and 855:
Table of Contents No dealer, salesp
- Page 856 and 857:
Washington, DC 20549-9040 (202) 551
- Page 858 and 859:
Table of Contents CALCULATION OF RE
- Page 860 and 861:
TABLE OF CONTENTS ABOUT THIS PROSPE
- Page 862 and 863:
Table of Contents Risks and uncerta
- Page 864 and 865:
Table of Contents Stock will automa
- Page 867 and 868:
Table of Contents Anti-Dilution Adj
- Page 869 and 870:
Table of Contents Voting Rights Ran
- Page 871 and 872:
Table of Contents The market price
- Page 873 and 874:
Table of Contents The Series G Pref
- Page 875 and 876:
Table of Contents DESCRIPTION OF NA
- Page 877 and 878:
Table of Contents Certificate of De
- Page 879 and 880:
Table of Contents Where, OS 0 = the
- Page 881 and 882:
Table of Contents with a tender or
- Page 883 and 884:
Table of Contents Right to Elect Tw
- Page 885 and 886:
Table of Contents participating, op
- Page 887 and 888:
Table of Contents based on the high
- Page 889 and 890:
Table of Contents CERTAIN U.S. FEDE
- Page 891 and 892:
Table of Contents Stock or our comm
- Page 893 and 894:
Table of Contents other requirement
- Page 895 and 896:
Table of Contents CERTAIN ERISA CON
- Page 897 and 898:
Table of Contents SELLING STOCKHOLD
- Page 899 and 900:
Table of Contents Shares of Series
- Page 901:
Table of Contents Shares of Series
- Page 904 and 905:
Table of Contents Shares of Series
- Page 906 and 907:
Table of Contents Shares of Series
- Page 908 and 909:
(12) Aristeia Capital LLC is the in
- Page 910 and 911:
Table of Contents (22) All of the e
- Page 913 and 914:
Table of Contents Each of SAC Capit
- Page 915 and 916:
Table of Contents EXPERTS The conso
- Page 917 and 918:
TABLE OF CONTENTS Prospectus About
- Page 919 and 920:
Table of Contents You may request a
- Page 921 and 922:
Fallon, Zachary From: Krawitz, Jaco
- Page 923 and 924:
Confidential # Producer How To Use
- Page 925 and 926:
Price $30.00 $25.00 $20.00 $15.00 $
- Page 927 and 928:
Price $20.00 $18.00 $16.00 $14.00 $
- Page 929 and 930:
Price $50.00 $45.00 $40.00 $35.00 $
- Page 931 and 932:
dayn hour _NAME_ AIG_mean AIG_minp
- Page 933 and 934:
10 11 COL1 18.24242 17.62 18.9 1.28
- Page 935 and 936:
18 19 COL1 2.697085 2.58 2.8 0.22 1
- Page 937 and 938:
21.08166 159.9686 159.95 160.03 0.0
- Page 939 and 940:
20.65615 134.4959 130.43 145.89 15.
- Page 941 and 942:
GS_close LEH_meanLEH_minp LEH_maxpL
- Page 943 and 944:
7.766267 7.44 8.2 0.76 1864755 2700
- Page 945 and 946:
142.51 129.8
- Page 947 and 948:
24.59935 24.21 24.9 0.69 0 33850 27
- Page 949 and 950:
18.62415 17.26 19.45 2.19 1793447 3
- Page 951 and 952:
MS_minp MS_maxp MS_rangepMS_tradeb
- Page 953 and 954:
38.08 39.04 0.96 342900 3791667 39.
- Page 955 and 956:
22.81 25.07 2.26 0 176151 39.31129
- Page 957 and 958:
4.0454 26650 4.02 0.12 5/18/1927 16
- Page 959 and 960:
2.17 0.18 15724864 47826532 3.96374
- Page 961 and 962:
MER_shortGS_shorta GS_shortp AIG_sh
- Page 963 and 964:
23.01972 855059 156.7115 5143237 18
- Page 965 and 966:
22.71091 19061 114.533 600 2.75 127
- Page 967 and 968:
2200 6000 100 7200 26800 3.919888 3
- Page 969 and 970:
23916408 2.052039 81053295 38584977
- Page 971 and 972:
Fallon, Zachary From: Edwards, Amy
- Page 973 and 974:
2118 Wilshire Boulevard, #596 Santa
- Page 975 and 976:
SAS Output 20080925 60505724BANK OF
- Page 977 and 978:
SAS Output 20080916 261018105DOWNEY
- Page 979 and 980:
SAS Output 2008091734958B106 FORTRE
- Page 981 and 982:
SAS Output 20080922 493267405KEYCOR
- Page 983 and 984:
SAS Output 20080918 902973882US Ban
- Page 985 and 986:
SAS Output 20080918 929251106W HOLD
- Page 987 and 988:
SAS Output 20080925 939322103WASHIN
- Page 989 and 990:
Fallon, Zachary From: McCormick, Ti
- Page 991 and 992:
arrived, they might borrow real sha
- Page 993 and 994:
friendly relations with its short-s
- Page 995 and 996:
To: Jim Overdahl From: Tim McCormic
- Page 997 and 998:
Figure 1 Percent of Shares Outstand
- Page 999 and 1000:
Figure 3 Percent of Shares Outstand
- Page 1001 and 1002:
Figure 5 Percent of Shares Outstand
- Page 1003 and 1004:
Figure 7 Percent of Shares Outstand
- Page 1005 and 1006:
Figure 9 Percent of Shares Outstand
- Page 1007 and 1008:
• For exchange-listed issues, the
- Page 1009 and 1010:
Table 2 Average Daily Number of Sec
- Page 1011 and 1012:
Table 4 Summary Statistics for Secu
- Page 1013 and 1014:
Reg SHO Pilot Report DRAFT 9/14/200
- Page 1015 and 1016:
Reg SHO Pilot Report DRAFT 9/14/200
- Page 1017 and 1018:
Reg SHO Pilot Report DRAFT 9/14/200
- Page 1019 and 1020:
Reg SHO Pilot Report DRAFT 9/14/200
- Page 1021 and 1022:
Reg SHO Pilot Report DRAFT 9/14/200
- Page 1023 and 1024:
Reg SHO Pilot Report DRAFT 9/14/200
- Page 1025 and 1026:
Reg SHO Pilot Report DRAFT 9/14/200
- Page 1027 and 1028:
Reg SHO Pilot Report DRAFT 9/14/200
- Page 1029 and 1030:
Reg SHO Pilot Report DRAFT 9/14/200
- Page 1031 and 1032:
Reg SHO Pilot Report DRAFT 9/14/200
- Page 1033 and 1034:
Reg SHO Pilot Report DRAFT 9/14/200
- Page 1035 and 1036:
Reg SHO Pilot Report DRAFT 9/14/200
- Page 1037 and 1038:
Reg SHO Pilot Report DRAFT 9/14/200
- Page 1039 and 1040:
Reg SHO Pilot Report DRAFT 9/14/200
- Page 1041 and 1042:
Reg SHO Pilot Report DRAFT 9/14/200
- Page 1043 and 1044:
Reg SHO Pilot Report DRAFT 9/14/200
- Page 1045 and 1046:
Reg SHO Pilot Report DRAFT 9/14/200
- Page 1047 and 1048:
Reg SHO Pilot Report DRAFT 9/14/200
- Page 1049 and 1050:
Reg SHO Pilot Report DRAFT 9/14/200
- Page 1051 and 1052:
Reg SHO Pilot Report DRAFT 9/14/200
- Page 1053 and 1054:
Reg SHO Pilot Report DRAFT 9/14/200
- Page 1055 and 1056:
Reg SHO Pilot Report DRAFT 9/14/200
- Page 1057 and 1058:
Reg SHO Pilot Report DRAFT 9/14/200
- Page 1059 and 1060:
Reg SHO Pilot Report DRAFT 9/14/200
- Page 1061 and 1062:
Reg SHO Pilot Report DRAFT 9/14/200
- Page 1063 and 1064:
Reg SHO Pilot Report DRAFT 9/14/200
- Page 1065 and 1066:
Reg SHO Pilot Report DRAFT 9/14/200
- Page 1067 and 1068:
Reg SHO Pilot Report DRAFT 9/14/200
- Page 1069 and 1070:
Reg SHO Pilot Report DRAFT 9/14/200
- Page 1071 and 1072:
Reg SHO Pilot Report DRAFT 9/14/200
- Page 1073 and 1074:
Reg SHO Pilot Report DRAFT 9/14/200
- Page 1075 and 1076:
Reg SHO Pilot Report DRAFT 9/14/200
- Page 1077 and 1078:
Reg SHO Pilot Report DRAFT 9/14/200
- Page 1079 and 1080:
Reg SHO Pilot Report DRAFT 9/14/200
- Page 1081 and 1082:
Reg SHO Pilot Report DRAFT 9/14/200
- Page 1083 and 1084:
Reg SHO Pilot Report DRAFT 9/14/200
- Page 1085 and 1086:
Reg SHO Pilot Report DRAFT 9/14/200
- Page 1087 and 1088:
Reg SHO Pilot Report DRAFT 9/14/200
- Page 1089 and 1090:
Reg SHO Pilot Report DRAFT 9/14/200
- Page 1091 and 1092:
Reg SHO Pilot Report DRAFT 9/14/200
- Page 1093 and 1094:
Reg SHO Pilot Report DRAFT 9/14/200
- Page 1095 and 1096:
Reg SHO Pilot Report DRAFT 9/14/200
- Page 1097 and 1098:
Reg SHO Pilot Report DRAFT 9/14/200
- Page 1099 and 1100:
Reg SHO Pilot Report DRAFT 9/14/200
- Page 1101 and 1102:
permanent the relevant provisions o
- Page 1103 and 1104:
• The average daily dollar value
- Page 1105 and 1106:
Table 1 Summary Statistics on Fails
- Page 1107 and 1108:
Table 3 Summary Statistics on Fails
- Page 1109 and 1110:
2.5 2 1.5 1 0.5 0 20040401 20040825
- Page 1111 and 1112:
700 600 500 400 300 200 100 0 20050
- Page 1113 and 1114:
3 2.5 2 1.5 1 0.5 0 Figure 5 Fails
- Page 1115 and 1116:
2 1.5 1 0.5 0 Figure 7 Fails to Del
- Page 1117 and 1118:
Fail Category Settlement Days to Cl
- Page 1119 and 1120:
Reg SHO Pilot Report 2/12/2007 Tabl
- Page 1121 and 1122:
Reg SHO Pilot Report 2/12/2007 In J
- Page 1123 and 1124:
Reg SHO Pilot Report 2/12/2007 grou
- Page 1125 and 1126:
Reg SHO Pilot Report 2/12/2007 pilo
- Page 1127 and 1128:
Reg SHO Pilot Report 2/12/2007 Thir
- Page 1129 and 1130:
Reg SHO Pilot Report 2/12/2007 II H
- Page 1131 and 1132:
Reg SHO Pilot Report 2/12/2007 In 1
- Page 1133 and 1134:
Reg SHO Pilot Report 2/12/2007 With
- Page 1135 and 1136:
Reg SHO Pilot Report 2/12/2007 stoc
- Page 1137 and 1138:
Reg SHO Pilot Report 2/12/2007 This
- Page 1139 and 1140:
Reg SHO Pilot Report 2/12/2007 rule
- Page 1141 and 1142:
Reg SHO Pilot Report 2/12/2007 Simi
- Page 1143 and 1144:
Reg SHO Pilot Report 2/12/2007 The
- Page 1145 and 1146:
Reg SHO Pilot Report 2/12/2007 V Me
- Page 1147 and 1148:
Reg SHO Pilot Report 2/12/2007 R =
- Page 1149 and 1150:
Reg SHO Pilot Report 2/12/2007 dist
- Page 1151 and 1152:
Reg SHO Pilot Report 2/12/2007 acti
- Page 1153 and 1154:
Reg SHO Pilot Report 2/12/2007 Stoc
- Page 1155 and 1156:
Reg SHO Pilot Report 2/12/2007 side
- Page 1157 and 1158:
Reg SHO Pilot Report 2/12/2007 Stoc
- Page 1159 and 1160:
Reg SHO Pilot Report 2/12/2007 toge
- Page 1161 and 1162:
Reg SHO Pilot Report 2/12/2007 incr
- Page 1163 and 1164:
Reg SHO Pilot Report 2/12/2007 day
- Page 1165 and 1166:
Reg SHO Pilot Report 2/12/2007 mani
- Page 1167 and 1168: Reg SHO Pilot Report 2/12/2007 pilo
- Page 1169 and 1170: Reg SHO Pilot Report 2/12/2007 marg
- Page 1171 and 1172: Reg SHO Pilot Report 2/12/2007 acti
- Page 1173 and 1174: Reg SHO Pilot Report 2/12/2007 lowe
- Page 1175 and 1176: Reg SHO Pilot Report 2/12/2007 Refe
- Page 1177 and 1178: Reg SHO Pilot Report 2/12/2007 Tabl
- Page 1179 and 1180: Reg SHO Pilot Report 2/12/2007 Tabl
- Page 1181 and 1182: Reg SHO Pilot Report 2/12/2007 Tabl
- Page 1183 and 1184: Reg SHO Pilot Report 2/12/2007 Tabl
- Page 1185 and 1186: Reg SHO Pilot Report 2/12/2007 Tabl
- Page 1187 and 1188: Reg SHO Pilot Report 2/12/2007 Tabl
- Page 1189 and 1190: Reg SHO Pilot Report 2/12/2007 Tabl
- Page 1191 and 1192: Reg SHO Pilot Report 2/12/2007 Tabl
- Page 1193 and 1194: Reg SHO Pilot Report 2/12/2007 Tabl
- Page 1195 and 1196: Reg SHO Pilot Report 2/12/2007 Tabl
- Page 1197 and 1198: Reg SHO Pilot Report 2/12/2007 Tabl
- Page 1199 and 1200: Reg SHO Pilot Report 2/12/2007 Tabl
- Page 1201 and 1202: Reg SHO Pilot Report 2/12/2007 Figu
- Page 1203 and 1204: Reg SHO Pilot Report 2/12/2007 Tabl
- Page 1205 and 1206: Reg SHO Pilot Report 2/12/2007 Stud
- Page 1207 and 1208: TO: File FROM: Office of Economic A
- Page 1209 and 1210: • The average daily number of opt
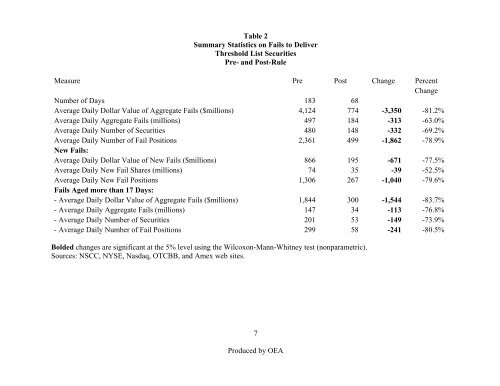
- Page 1211 and 1212: Table 2 Summary Statistics on Fails
- Page 1213 and 1214: provides for a 35-settlement day ph
- Page 1215 and 1216: • The average daily number of fai
- Page 1217: Table 1 Summary Statistics on Fails
- Page 1221 and 1222: 2.5 2 1.5 1 0.5 0 20040401 20040825
- Page 1223 and 1224: 700 600 500 400 300 200 100 0 20050
- Page 1225 and 1226: 2.5 2 1.5 1 0.5 0 20080602 20080616
- Page 1227 and 1228: 1.6 1.4 1.2 1 0.8 0.6 0.4 0.2 0 200
- Page 1229 and 1230: TO: File FROM: Office of Economic A
- Page 1231 and 1232: All Securities (Table 1): Table 1 s
- Page 1233 and 1234: Daily Fails to Deliver in All Secur
- Page 1235 and 1236: Table 2 Summary Statistics on Fails
- Page 1237 and 1238: Table 4 Summary Statistics on Fails
- Page 1239 and 1240: 700 600 500 400 300 200 100 0 0501
- Page 1241 and 1242: 1.4 1.2 1 0.8 0.6 0.4 0.2 0 2005010
- Page 1243 and 1244: 700 600 500 400 300 200 100 0 20080
- Page 1245 and 1246: Number of Threshold Securities 700
- Page 1247 and 1248: TO: File FROM: Office of Economic A
- Page 1249 and 1250: • The average daily number of fai
- Page 1251 and 1252: Daily Number of Threshold List Secu
- Page 1253 and 1254: Table 2 Summary Statistics on Fails
- Page 1255 and 1256: Table 4 Summary Statistics on Fails
- Page 1257 and 1258: 700 600 500 400 300 200 100 0 0501
- Page 1259 and 1260: 1.4 1.2 1 0.8 0.6 0.4 0.2 0 2005010
- Page 1261 and 1262: 700 600 500 400 300 200 100 0 20080
- Page 1263 and 1264: Fail Category Settlement Days to Cl
- Page 1265 and 1266: Short Selling in Initial Public Off
- Page 1267 and 1268: delay, as previously thought. Short
- Page 1269 and 1270:
threshold list on the first possibl
- Page 1271 and 1272:
Both Geczy, Musto and Reed (2002) a
- Page 1273 and 1274:
esponsible for the Internet bubble.
- Page 1275 and 1276:
on periods during the tech bubble.
- Page 1277 and 1278:
trading although the levels are qui
- Page 1279 and 1280:
in offer price as measured as the p
- Page 1281 and 1282:
ule allows short sales to execute a
- Page 1283 and 1284:
negative and occasionally significa
- Page 1285 and 1286:
SROs daily for stocks that have agg
- Page 1287 and 1288:
place it on a list known as the Reg
- Page 1289 and 1290:
order to provide price support. Agg
- Page 1291 and 1292:
Panel B of Table 6 presents the det
- Page 1293 and 1294:
In focusing on the potential short
- Page 1295 and 1296:
During our sample period, Regulatio
- Page 1297 and 1298:
The perceived inability of short se
- Page 1299 and 1300:
References Aggarwal, Reena and Pat
- Page 1301 and 1302:
Houge, Todd, Tim Loughran, Gerry Su
- Page 1303 and 1304:
Table 2 Comparison of First Day Tra
- Page 1305 and 1306:
Table 4 Summary Statistics on Fails
- Page 1307 and 1308:
Variable Table 6 Determinants of Lo
- Page 1309 and 1310:
Table 8 Short Term Price Effects Th
- Page 1311 and 1312:
Figure 1 Distribution of Short Sell
- Page 1313 and 1314:
Figure 3 Short Selling, Returns and
- Page 1315:
Figure 5 Short Selling and Failures