Attention! Your ePaper is waiting for publication!
By publishing your document, the content will be optimally indexed by Google via AI and sorted into the right category for over 500 million ePaper readers on YUMPU.
This will ensure high visibility and many readers!

Your ePaper is now published and live on YUMPU!
You can find your publication here:
Share your interactive ePaper on all platforms and on your website with our embed function

SEC Follow Up Exhibits Part C SEC_OEA_FCIC_001760-2501
SEC Follow Up Exhibits Part C SEC_OEA_FCIC_001760-2501
SEC Follow Up Exhibits Part C SEC_OEA_FCIC_001760-2501

Create successful ePaper yourself
Turn your PDF publications into a flip-book with our unique Google optimized e-Paper software.
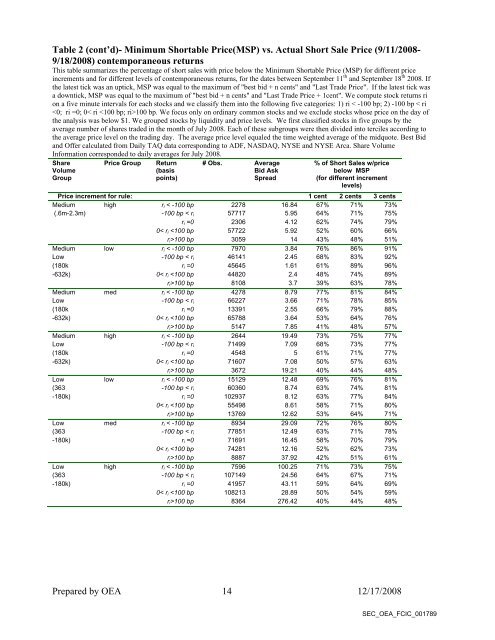
Table 2 (cont’d)- Minimum Shortable Price(MSP) vs. Actual Short Sale Price (9/11/2008-<br />
9/18/2008) contemporaneous returns<br />
This table summarizes the percentage of short sales with price below the Minimum Shortable Price (MSP) for different price<br />
increments and for different levels of contemporaneous returns, for the dates between September 11 th and September 18 th 2008. If<br />
the latest tick was an uptick, MSP was equal to the maximum of "best bid + n cents" and "Last Trade Price". If the latest tick was<br />
a downtick, MSP was equal to the maximum of "best bid + n cents" and "Last Trade Price + 1cent". We compute stock returns ri<br />
on a five minute intervals for each stocks and we classify them into the following five categories: 1) ri < -100 bp; 2) -100 bp < ri<br />
Table 2 (cont’d)- Minimum Shortable Price(MSP) vs. Actual Short Sale Price (9/11/2008- 9/18/2008) contemporaneous returns This table summarizes the percentage of short sales with price below the Minimum Shortable Price (MSP) for different price increments and for different levels of contemporaneous returns, for the dates between September 11 th and September 18 th 2008. If the latest tick was an uptick, MSP was equal to the maximum of "best bid + n cents" and "Last Trade Price". If the latest tick was a downtick, MSP was equal to the maximum of "best bid + n cents" and "Last Trade Price + 1cent". We compute stock returns ri on a five minute intervals for each stocks and we classify them into the following five categories: 1) ri < -100 bp; 2) -100 bp < ri
Table 3 Minimum Shortable Price(MSP) vs. Actual Short Sale Price (9/11/2008-9/18/2008) lagged returns This table summarizes the percentage of short sales with price below the Minimum Shortable Price (MSP) for different price increments and for different levels of lagged returns, for the dates between September 11 th and September 18 th 2008. If the latest tick was an uptick, MSP was equal to the maximum of "best bid + n cents" and "Last Trade Price". If the latest tick was a downtick, MSP was equal to the maximum of "best bid + n cents" and "Last Trade Price + 1cent". We computed stock returns ri on a five minute intervals for each stocks and we classified them into the following five categories: 1) ri < -100 bp; 2) -100 bp < ri 7m) -100 bp < ri 7m) -100 bp < ri 7m) -100 bp < ri
- Page 1 and 2: TO: Distribution List DRAFT MEMORAN
- Page 3 and 4: DRAFT on short selling, particularl
- Page 5 and 6: Price pressure DRAFT Several empiri
- Page 7 and 8: DRAFT these measures are designed t
- Page 9 and 10: DRAFT the highly automated markets
- Page 11 and 12: submitted analyses that are not dir
- Page 13 and 14: The CFA Institute Centre for Financ
- Page 15 and 16: DRAFT National Association of Real
- Page 17 and 18: To: Chairman Christopher Cox Throug
- Page 19 and 20: In our analyses, (described in furt
- Page 21 and 22: 4. 0< ri 100 bp where bp is basis p
- Page 23 and 24: We also found that changes in the p
- Page 25 and 26: - If the order was submitted at the
- Page 27 and 28: ates were 56%. This asymmetry holds
- Page 29: Table 2 - Minimum Shortable Price(M
- Page 33 and 34: Table 4 - Minimum Shortable Price(M
- Page 35 and 36: Table 5 Minimum Shortable Price(MSP
- Page 37 and 38: Table 5 (cont’d) Minimum Shortabl
- Page 39 and 40: Table 6 (Cont’d) Minimum Shortabl
- Page 41 and 42: Table 7-A Stocks: Three sampled sto
- Page 43 and 44: OFFICE OF ECONOMIC ANALYSIS DRAFT M
- Page 45 and 46: Historical Context To aid in evalua
- Page 47 and 48: Market Volatility Forecast The grap
- Page 49 and 50: Root Mean Squared Return 0.006 0.00
- Page 51 and 52: Abnormal End-of-Day Volatility In o
- Page 53 and 54: To further investigate historical p
- Page 55 and 56: 1 0.9 0.8 0.7 0.6 0.5 0.4 0.3 0.2 0
- Page 57 and 58: Appendix 2: Open-To-Close vs. Overn
- Page 59 and 60: Appendix 3: Extreme Days The analys
- Page 61 and 62: Index (15:20 = 1) 1.01 1 0.99 0.98
- Page 63 and 64: 810 800 790 780 770 760 750 740 Fig
- Page 65 and 66: Have a great week end. Christophe 2
- Page 67 and 68: Smith, Kathrin From: Bisiere, Chris
- Page 69 and 70: SEC_OEA_FCIC_001828
- Page 71 and 72: SEC_OEA_FCIC_001830
- Page 73 and 74: SEC_OEA_FCIC_001832
- Page 75 and 76: Smith, Kathrin From: Bisiere, Chris
- Page 77 and 78: SEC_OEA_FCIC_001836
- Page 79 and 80: SEC_OEA_FCIC_001838
- Page 81 and 82:
SEC_OEA_FCIC_001840
- Page 83 and 84:
SEC_OEA_FCIC_001842
- Page 85 and 86:
In-Threshold Run Length in Number o
- Page 87 and 88:
Beta Excess Return cond. on # of da
- Page 89 and 90:
Beta Excess Return cond. on # of da
- Page 91 and 92:
Beta Excess Return cond. on # of da
- Page 93 and 94:
Beta Excess Return cond. on in-thre
- Page 95 and 96:
Total Notional Amount (DTCC) Millio
- Page 97 and 98:
Summary of Citigroup Credit Default
- Page 99 and 100:
Summary of Citigroup Credit Default
- Page 101 and 102:
Summary of Citigroup Credit Default
- Page 103 and 104:
Summary of Citigroup Credit Default
- Page 105 and 106:
Total Notional Amount (DTCC) Millio
- Page 107 and 108:
Total Notional Amount (DTCC) Millio
- Page 109 and 110:
Total Notional Amount (DTCC) Millio
- Page 111 and 112:
Total Notional Amount (DTCC) Millio
- Page 113 and 114:
Total Notional Amount (DTCC) Millio
- Page 115 and 116:
Total Notional Amount (DTCC) Millio
- Page 117 and 118:
Total Notional Amount (DTCC) Millio
- Page 119 and 120:
Total Notional Amount (DTCC) Millio
- Page 121 and 122:
Total Notional Amount (DTCC) Millio
- Page 123 and 124:
Total Notional Amount (DTCC) Millio
- Page 125 and 126:
date _NAME_ TD_C AB_C AS_C TM_C 11/
- Page 127 and 128:
ALADDIN R 1 Citigroup Credit Defaul
- Page 129 and 130:
Citigroup Credit Default Swap Trans
- Page 131 and 132:
namegroup idname _NAME_ rangen day_
- Page 133 and 134:
CEDAR HILL CAP 18 bullish bull_18 1
- Page 135 and 136:
GOLDMAN SACHS 35 ssell ssel_35 -10,
- Page 137 and 138:
MERRILL LYNCH 53 bullish bull_53 5,
- Page 139 and 140:
PIM2136 70 ssell ssel_70 PIM2224 71
- Page 141 and 142:
PIM3706 88 bullish bull_88 200,000
- Page 143 and 144:
ROYAL BANK OF 105 ssell ssel_105 -5
- Page 145 and 146:
Summary of Citigroup Credit Default
- Page 147 and 148:
Total Notional Amount (DTCC) Millio
- Page 149 and 150:
Total Notional Amount (DTCC) Millio
- Page 151 and 152:
Total Notional Amount (DTCC) Millio
- Page 153 and 154:
Total Notional Amount (DTCC) Millio
- Page 155 and 156:
Total Notional Amount (DTCC) Millio
- Page 157 and 158:
Total Notional Amount (DTCC) Millio
- Page 159 and 160:
Total Notional Amount (DTCC) Millio
- Page 161 and 162:
Total Notional Amount (DTCC) Millio
- Page 163 and 164:
PIM6888 100 Citigroup Credit Defaul
- Page 165 and 166:
- 91 41 Bearish # - / Bullish # 91
- Page 167 and 168:
BLUE MTN CREDI 12 abuy abuy_12 -20,
- Page 169 and 170:
GENERAL ELECT 34 bearish bear_34 GE
- Page 171 and 172:
NATIONAL BANK O 56 cnet cnet_56 0 -
- Page 173 and 174:
PIM2679 78 sbuy sbuy_78 PIM2679 78
- Page 175 and 176:
PROVINZIAL RHE 101 abuy abuy_101 PR
- Page 177 and 178:
Summary of Citigroup Credit Default
- Page 179 and 180:
Price $15.00 $12.50 $10.00 $7.50 $5
- Page 181 and 182:
21 18 COL1 3.807082 3.54 4.04 0.5 3
- Page 183 and 184:
Total Notional Amount (DTCC) Millio
- Page 185 and 186:
Summary of Citigroup Credit Default
- Page 187 and 188:
Summary of Citigroup Credit Default
- Page 189 and 190:
Summary of Citigroup Credit Default
- Page 191 and 192:
Summary of Citigroup Credit Default
- Page 193 and 194:
Total Notional Amount (DTCC) Millio
- Page 195 and 196:
Total Notional Amount (DTCC) Millio
- Page 197 and 198:
Total Notional Amount (DTCC) Millio
- Page 199 and 200:
Total Notional Amount (DTCC) Millio
- Page 201 and 202:
Total Notional Amount (DTCC) Millio
- Page 203 and 204:
Date Open High Low Close Volume Adj
- Page 205 and 206:
date2 _NAME_2 no_NoPay_C fi_NoPay_C
- Page 207 and 208:
PIM6888 100 Citigroup Credit Defaul
- Page 209 and 210:
- 91 41 Bearish # - / Bullish # 91
- Page 211 and 212:
BLACK DIAMOND OFFSHORE, LTD 11 abuy
- Page 213 and 214:
FORE ERISA FUND, LTD. 31 bearish be
- Page 215 and 216:
MARATHON 51 cnet cnet_51 0 0 -45,00
- Page 217 and 218:
PIM2224 71 sbuy sbuy_71 1,000,000 P
- Page 219 and 220:
PIM4807 92 abuy abuy_92 PIM4807 92
- Page 221 and 222:
THE ROYAL BANK OF SCOTLAND PLC 112
- Page 223 and 224:
11/18/08 -17000000 10000000 -7,000,
- Page 225 and 226:
Summary of Citigroup Credit Default
- Page 227 and 228:
Adjusted Close 25 20 15 10 5 0 10/1
- Page 229 and 230:
Summary of Citigroup Credit Default
- Page 231 and 232:
Summary of Citigroup Credit Default
- Page 233 and 234:
Summary of Citigroup Credit Default
- Page 235 and 236:
Summary of Citigroup Credit Default
- Page 237 and 238:
BBVA DerivServ SUBMITTING_PARTY SUB
- Page 239 and 240:
BUYER_NAME SELLER_ID SELLER_NAME TR
- Page 241 and 242:
SUBMIT_DATE SUBMIT_TIME TRANSACTION
- Page 243 and 244:
NOTIONAL_AMOUNT NOTIONAL_CURRENCY A
- Page 245 and 246:
POST_TRADE_PAYMENT_DATE POST_TRADE_
- Page 247 and 248:
PERIOD_MULTIPLIER PAYMENT_FREQUENCY
- Page 249 and 250:
INITIAL_CURRENCY RESTRUCTING_INDICA
- Page 251 and 252:
MATRIX_TYPE PUBLICATION_DATE 01/01/
- Page 253 and 254:
MATRIX_AGREEMENT_DATE ASSIGNMENT_RO
- Page 255 and 256:
Total Notional Amount (DTCC) Millio
- Page 257 and 258:
Total Notional Amount (DTCC) Millio
- Page 259 and 260:
Total Notional Amount (DTCC) Millio
- Page 261 and 262:
Total Notional Amount (DTCC) Millio
- Page 263 and 264:
Total Notional Amount (DTCC) Millio
- Page 265 and 266:
Total Notional Amount (DTCC) Millio
- Page 267 and 268:
Total Notional Amount (DTCC) Millio
- Page 269 and 270:
date _NAME_ TD_C AB_C AS_C TM_C 11/
- Page 271 and 272:
ALADDIN R 1 Citigroup Credit Defaul
- Page 273 and 274:
Citigroup Credit Default Swap Trans
- Page 275 and 276:
namegroup idname _NAME_ rangen day_
- Page 277 and 278:
CREDIT SUISSE INTERNATIONAL 21 abuy
- Page 279 and 280:
INTERN KAPIT MBH (PRV-C) 41 bearish
- Page 281 and 282:
PIM1356 61 cnet cnet_61 500,000 500
- Page 283 and 284:
PIM2755 81 sbuy sbuy_81 300,000 PIM
- Page 285 and 286:
PURSUIT 102 abuy abuy_102 PURSUIT 1
- Page 287 and 288:
BNP Paribas Securities Corp. Top No
- Page 289 and 290:
Summary of Citigroup Credit Default
- Page 291 and 292:
Volume (thousands) 1 , 1 0 0 1 , 0
- Page 293 and 294:
Volume (thousands) 3 , 0 0 0 2 , 0
- Page 295 and 296:
Volume (thousands) 7 , 0 0 0 6 , 0
- Page 297 and 298:
Volume (thousands) Price and Volume
- Page 299 and 300:
Volume (thousands) Price and Volume
- Page 301 and 302:
Volume (thousands) 1 , 1 0 0 1 , 0
- Page 303 and 304:
Volume (thousands) 4 , 0 0 0 3 , 0
- Page 305 and 306:
Volume (thousands) 3 0 2 0 1 0 0 Pr
- Page 307 and 308:
security on each calendar day of th
- Page 309 and 310:
10. Percentage of short positions c
- Page 311 and 312:
selling. The purple bar indicates t
- Page 313 and 314:
Chart 1 Form SH Daily Volume Compar
- Page 315 and 316:
Form SH Reported Short Volume for C
- Page 317 and 318:
Form SH Data Quality Check of Volum
- Page 319 and 320:
Form SH Summary of Securities by CR
- Page 321 and 322:
# of Securities (3,989 Total) 1,600
- Page 323 and 324:
# Security - Days (3,899 Total) 600
- Page 325 and 326:
Form SH Reported Data Compared to O
- Page 327 and 328:
# Daily Positions 300,000 250,000 2
- Page 329 and 330:
# Daily Volumes 45,000 40,000 35,00
- Page 331 and 332:
Securities Reported by Filers 30,00
- Page 333 and 334:
Dollar Value Sold Short ($ Millions
- Page 335 and 336:
# of Security Days with Some Report
- Page 337 and 338:
# of Security Days with Significant
- Page 339 and 340:
Price $0.20 $0.19 $0.18 $0.17 $0.16
- Page 341 and 342:
Price $3.00 $2.50 $2.00 $1.50 $1.00
- Page 343 and 344:
Price $17.50 $17.00 $16.50 $16.00 $
- Page 345 and 346:
Price $50.00 $45.00 $40.00 $35.00 $
- Page 347 and 348:
Price $2.40 $2.35 $2.30 $2.25 $2.20
- Page 349 and 350:
Price $16.00 $14.00 $12.00 $10.00 $
- Page 351 and 352:
dayn trade_date COMNAM PERMNO SHRCD
- Page 353 and 354:
14 14-Nov-08 HONEYWE 10145 11 20.16
- Page 355 and 356:
14 14-Nov-08 STURM RU 73219 11 0.00
- Page 357 and 358:
14 14-Nov-08 G A T X CO 12036 11 0.
- Page 359 and 360:
14 14-Nov-08 MAGUIRE 89768 18 35.07
- Page 361 and 362:
14 14-Nov-08 EMERITUS 82638 11 0.32
- Page 363 and 364:
14 14-Nov-08 GRAY TEL 83989 11 76.5
- Page 365 and 366:
14 14-Nov-08 CYTEC IND 80079 11 1.5
- Page 367 and 368:
14 14-Nov-08 TEXTAINE 92379 12 1.02
- Page 369 and 370:
14 14-Nov-08 CONSOL E 86799 11 3.04
- Page 371 and 372:
28 ######## DORAL FIN 12169 11 0.00
- Page 373 and 374:
volp_b _TYPE_ _FREQ_ countvolp volp
- Page 375 and 376:
shortpct ndays ndays_downdays_flat
- Page 377 and 378:
ndays_nex ndays_nex COMNAM 1 1 RITC
- Page 379 and 380:
PERMNO trade_date sdevv vol_crsp vo
- Page 381 and 382:
trade_date _NAME_ PRC_1 prc_down_ p
- Page 383 and 384:
vol_rest_7 PRC_10 prc_down_ prc_up_
- Page 385 and 386:
TY ENTERPRISES INC Y CO E BRANDS IN
- Page 387 and 388:
17 0 191 191 17 18 0 154 154 18 19
- Page 389 and 390:
nfilers_hist count low high lab1 _T
- Page 391 and 392:
date day_week count count_vol count
- Page 393 and 394:
Price $46.00 $45.00 $44.00 $43.00 $
- Page 395 and 396:
Price $46.00 $45.00 $44.00 $43.00 $
- Page 397 and 398:
Price $46.00 $45.00 $44.00 $43.00 $
- Page 399 and 400:
Price $46.00 $45.00 $44.00 $43.00 $
- Page 401 and 402:
Price $40.00 $35.00 $30.00 $25.00 $
- Page 403 and 404:
Price $40.00 $35.00 $30.00 $25.00 $
- Page 405 and 406:
Price $40.00 $35.00 $30.00 $25.00 $
- Page 407 and 408:
Symbol hour minute sort trend5_2 tr
- Page 409 and 410:
MS 17 43 0 MS 17 44 0 MS 17 45 0 MS
- Page 411 and 412:
MS 8 27 1 MS 8 28 1 MS 8 29 1 MS 8
- Page 413 and 414:
MS 10 11 1 MS 10 12 1 MS 10 13 1 MS
- Page 415 and 416:
MS 11 55 1 MS 11 56 1 MS 11 57 1 MS
- Page 417 and 418:
MS 13 39 1 MS 13 40 1 MS 13 41 1 MS
- Page 419 and 420:
MS 15 23 1 MS 15 24 1 MS 15 25 1 MS
- Page 421 and 422:
HBB HBB HBB HBB HBB HBB HBB HBB HBB
- Page 423 and 424:
HBB LBB HBB LBB HBB LBB HBB LBB HBB
- Page 425 and 426:
LBB LBB LBB LBB LBB LBB
- Page 427 and 428:
HBB HBB HBB HBB HBB HBB HBB HBB HBB
- Page 429 and 430:
118679 140734 81539 98153 119580 10
- Page 431 and 432:
549976 740793 730713 530553 633869
- Page 433 and 434:
241120 221885 463089 242404 268242
- Page 435 and 436:
1034773 507119 1929040 729702 21777
- Page 437 and 438:
down5_8 down5_9 down5_10 down5_11 d
- Page 439 and 440:
594851 477540 815219 558737 595063
- Page 441 and 442:
533491 248814 375456 321906 302504
- Page 443 and 444:
624651 1105941 805570 1053176 11970
- Page 445 and 446:
4200 37163 300 200 7379 500 700 100
- Page 447 and 448:
100 100 1501 600 621 330 4000 1200
- Page 449 and 450:
100 600 500 5500 100 200 1200 3800
- Page 451 and 452:
20910 36164 30643 155502 74702 1124
- Page 453 and 454:
34196 19500 55548 30203 29025 49981
- Page 455 and 456:
33038 9300 33512 28113 24513 31940
- Page 457 and 458:
trade_12 trade_15 trade_16 trade_17
- Page 459 and 460:
3259 4060 1301 3600 6100 410 3800 1
- Page 461 and 462:
245 23292 29685 32235 131277 50646
- Page 463 and 464:
94506 158205 426920 1103544 257455
- Page 465 and 466:
16200 110995 231657 425131 597896 4
- Page 467 and 468:
37430 109134 110898 474335 769341 7
- Page 469 and 470:
53417 181823 546172 342284 49297 19
- Page 471 and 472:
MS 16 49 MS 16 50 MS 16 51 MS 16 52
- Page 473 and 474:
MS 18 33 MS 18 34 MS 18 35 MS 18 36
- Page 475 and 476:
MS 9 17 MS 9 18 MS 9 19 MS 9 20 MS
- Page 477 and 478:
MS 11 1 MS 11 2 MS 11 3 MS 11 4 MS
- Page 479 and 480:
MS 12 45 MS 12 46 MS 12 47 MS 12 48
- Page 481 and 482:
MS 14 29 MS 14 30 MS 14 31 MS 14 32
- Page 483 and 484:
spindex__ meanp_2 minp_2 maxp_2 ran
- Page 485 and 486:
41.16
- Page 487 and 488:
41.46327 41.45829 41.46125 41.46493
- Page 489 and 490:
42.14067 42.1 42.23 0.13 0 35200 41
- Page 491 and 492:
42.04836 42 42.1 0.1 0 24500 41.392
- Page 493 and 494:
41.39925 41.39 41.42 0.03 0 24442 4
- Page 495 and 496:
40.86447 40.82 40.88 0.06 0 28120 4
- Page 497 and 498:
41.3 41.3 0 13055 0 41.2573 41.2701
- Page 499 and 500:
41.052 41.06055 41.04888 41.1732 41
- Page 501 and 502:
41.18338 41.19231 41.19168 41.19479
- Page 503 and 504:
41.73 41.82 0.09 0 22423 41.24243 4
- Page 505 and 506:
41.49 41.54 0.05 0 13778 40.99331 4
- Page 507 and 508:
41.45 41.48 0.03 0 15300 41.02212 4
- Page 509 and 510:
angep_4 tradebig_4 tradesmall_spind
- Page 511 and 512:
42.18422 42.18422 42.18272 0 0 100
- Page 513 and 514:
41.97166 41.96509 41.98361 41.98375
- Page 515 and 516:
0.1289 12200 82640 41.8887 40.12155
- Page 517 and 518:
0.09 0 21945 41.41648 40.53181 40.4
- Page 519 and 520:
0.08 0 51100 41.11773 41.09831 41.0
- Page 521 and 522:
0.1 0 43500 41.07753 40.66593 40.64
- Page 523 and 524:
40.35161 41.72151 40.34821 41.72793
- Page 525 and 526:
100 40.23214 44.32539 44.3 44.51 0.
- Page 527 and 528:
40.04062 44.11875 44.1 44.15 0.05 0
- Page 529 and 530:
37530 39.78727 41.9703 41.88 42.08
- Page 531 and 532:
17590 40.17506 42.82236 42.77 42.86
- Page 533 and 534:
23962 40.35303 42.48832 42.45 42.55
- Page 535 and 536:
meanp_9 minp_9 maxp_9 rangep_9 trad
- Page 537 and 538:
43.18457 43.18117 43.19477 43.18627
- Page 539 and 540:
43.36903 43.37727 39.7425 39.74 43.
- Page 541 and 542:
42.95786 42.87 43 0.13 0 70242 43.1
- Page 543 and 544:
42.17411 42.14 42.24 0.1 0 90289 42
- Page 545 and 546:
41.78421 41.74 41.84 0.1 0 26343 42
- Page 547 and 548:
40.50608 40.45 40.55 0.1 0 34709 42
- Page 549 and 550:
40.4893 40.45867 40.4 0 41937 0 40.
- Page 551 and 552:
40 0.05 0 600 40.50209 37.71002 37.
- Page 553 and 554:
39.94 0.13 0 2192 40.67039 35.91425
- Page 555 and 556:
38.32 0.14 0 111093 40.37693 37.312
- Page 557 and 558:
39.02 0.08 0 34460 40.69035 37.5625
- Page 559 and 560:
40.07 0.05 0 21911 40.88056 38.7236
- Page 561 and 562:
tradebig_11tradesmall_spindex_11mea
- Page 563 and 564:
39.07 39.07 39.07 0 0 100 39.05293
- Page 565 and 566:
0 1500 38.43361 0 500 38.39862 38.2
- Page 567 and 568:
0 208240 38.53788 37.8859 37.84 37.
- Page 569 and 570:
0 119996 38.95339 39.13122 39.06 39
- Page 571 and 572:
0 44256 38.79547 37.98676 37.94 38.
- Page 573 and 574:
0 110077 39.01476 38.22831 38.21 38
- Page 575 and 576:
38.70023 37.3634 38.72405 37.23349
- Page 577 and 578:
38.55764 34.03986 33.9 34.5 0.6 0 8
- Page 579 and 580:
38.32867 32.99608 32.99 33.01 0.02
- Page 581 and 582:
38.63587 34.58665 34.56 34.66 0.1 4
- Page 583 and 584:
38.56625 33.82328 33.76 33.88 0.12
- Page 585 and 586:
38.54373 32.38956 32.27 32.5 0.23 0
- Page 587 and 588:
minp_16 maxp_16 rangep_16 tradebig_
- Page 589 and 590:
32.13448 31.78 31.78 0 0 200 32.134
- Page 591 and 592:
27.86 28.24 0.38 0 60290 31.67596 2
- Page 593 and 594:
28.025 28.75 0.725 59400 618974 31.
- Page 595 and 596:
26.42 26.78 0.36 0 182872 31.98663
- Page 597 and 598:
27.83 27.995 0.165 0 85468 32.13794
- Page 599 and 600:
28.42 28.8 0.38 40100 308589 32.558
- Page 601 and 602:
0.38 0 7875 28.54326 22.66857 22.58
- Page 603 and 604:
0.4 0 37836 28.72396 22.84878 22.55
- Page 605 and 606:
0.46 23416 91786 28.11341 20.14171
- Page 607 and 608:
0.29 0 408554 27.96835 19.59765 19.
- Page 609 and 610:
0.225 0 494911 27.84082 15.32434 14
- Page 611 and 612:
0.56 145997 1370219 27.91591 17.442
- Page 613 and 614:
tradesmall_spindex_18meanp_19 minp_
- Page 615 and 616:
2900 21.79807 22.57521 7500 22.7348
- Page 617 and 618:
59616 21.91836 32.85777 32.69 33 0.
- Page 619 and 620:
813439 22.14338 25.76577 24.85 26.7
- Page 621 and 622:
463989 21.6108 28.04861 27.99 28.12
- Page 623 and 624:
439396 21.88219 28.96691 28.85 29.0
- Page 625 and 626:
1307381 22.45974 25.50933 25.1388 2
- Page 627 and 628:
27.09373 0 26.89034 26.75 26.9 0.15
- Page 629 and 630:
0 0 0 0 0 0 0 0 0 0 0 0 0 0 0 0 0 0
- Page 631 and 632:
1 1 1 1 1 1 1 1 1 1 1 1 1 1 1 1 1 1
- Page 633 and 634:
1 1 1 1 1 1 1 1 1 1 1 1 1 1 1 1 1 1
- Page 635 and 636:
1 1 1 1 1 1 1 1 1 1 1 1 1 1 1 1 1:0
- Page 637 and 638:
1 1 1 1 1 1 1 1 1 1 1 1 1 1 1 1 1 1
- Page 639:
verticle close_1 close_2 close_3 cl
- Page 643 and 644:
40.83 41.3 42.17 40.34 41.36 43.27
- Page 645 and 646:
50 51 52 53 54 55 56 57 58 59 60 61
- Page 647 and 648:
154 155 156 157 158 159 160 161 162
- Page 649 and 650:
258 259 260 261 262 263 264 265 266
- Page 651 and 652:
362 363 364 365 366 367 368 369 370
- Page 653 and 654:
466 467 468 469 470 471 472 473 474
- Page 655 and 656:
570 571 572 573 574 575 576 577 578
- Page 657 and 658:
Morgan Stanley Intraday Trading by
- Page 659 and 660:
Goldman Sachs September Activity Ja
- Page 661 and 662:
Trading Patterns of Interest • Tr
- Page 663 and 664:
Goldman Sachs Stock Price Summary P
- Page 665 and 666:
Goldman Sachs Intra-Day Stock Price
- Page 667 and 668:
Goldman Sachs Intra-Day Stock Price
- Page 669 and 670:
Goldman Sachs 21(a) Response - Exam
- Page 671 and 672:
Goldman Sachs 21(a) Response - Exam
- Page 673 and 674:
Morgan Stanley CDS Summary (Goldman
- Page 675 and 676:
Morgan Stanley CDS Transactions (Go
- Page 677 and 678:
Example 6: CDS (Using Morgan Stanle
- Page 679 and 680:
Goldman Sachs Example 8a: Assent St
- Page 681 and 682:
Goldman Sachs Example 8c: Assent St
- Page 683 and 684:
Summary File Common Stock Transacti
- Page 685 and 686:
Confidential 45 Wellington Capital
- Page 687 and 688:
OEA DRAFT - INTERNAL Therefore, exa
- Page 689 and 690:
Figure 2 Percent of Shares Outstand
- Page 691 and 692:
Figure 4 Percent of Shares Outstand
- Page 693 and 694:
Figure 6 Percent of Shares Outstand
- Page 695 and 696:
Figure 8 Percent of Shares Outstand
- Page 697 and 698:
Merrill Lynch September Activity Ja
- Page 699 and 700:
Trading Patterns of Interest • Tr
- Page 701 and 702:
Merrill Lynch Stock Price Summary P
- Page 703 and 704:
Merrill Lynch Intra-Day Stock Price
- Page 705 and 706:
Merrill Lynch Intra-Day Stock Price
- Page 707 and 708:
Merrill Lynch CDS Prices of New Tra
- Page 709 and 710:
Merrill Lynch CDS Transactions Top
- Page 711 and 712:
Merrill Lynch 21(a) Response - Exam
- Page 713 and 714:
Merrill Lynch 21(a) Response - Exam
- Page 715 and 716:
Merrill Lynch 21(a) Response - Exam
- Page 717 and 718:
Merrill Lynch Example 7a: Assent St
- Page 719 and 720:
Merrill Lynch Example 7c: Assent St
- Page 721 and 722:
Summary File Common Stock Transacti
- Page 723 and 724:
Morgan Stanley Stock Price Summary
- Page 725 and 726:
Morgan Stanley Intra-Day Stock Pric
- Page 727 and 728:
Morgan Stanley CDS Summary SEC_OEA_
- Page 729 and 730:
Morgan Stanley 21(a) Response - Exa
- Page 731 and 732:
Morgan Stanley 21(a) Response - Exa
- Page 733 and 734:
Morgan Stanley 21(a) Response - Exa
- Page 735 and 736:
Morgan Stanley 21(a) Response - Exa
- Page 737 and 738:
Summary File Common Stock Transacti
- Page 739 and 740:
Morgan Stanley September Activity J
- Page 741 and 742:
Trading Patterns of Interest • Tr
- Page 743 and 744:
Morgan Stanley Stock Price Summary
- Page 745 and 746:
Morgan Stanley Intra-Day Stock Pric
- Page 747 and 748:
Morgan Stanley Intra-Day Stock Pric
- Page 749 and 750:
Morgan Stanley CDS Prices of New Tr
- Page 751 and 752:
Morgan Stanley CDS Transactions Top
- Page 753 and 754:
Morgan Stanley Example 1b: CDS Cita
- Page 755 and 756:
Morgan Stanley Example 2b: CDS Paul
- Page 757 and 758:
Morgan Stanley Example 3b: CDS Deut
- Page 759 and 760:
Morgan Stanley Example 4b: CDS Merr
- Page 761 and 762:
Morgan Stanley Example 5b: Assent S
- Page 763 and 764:
Summary File Common Stock Transacti
- Page 765 and 766:
Washington Mutual September Activit
- Page 767 and 768:
Trading Patterns of Interest • Tr
- Page 769 and 770:
Washington Mutual Stock Price Summa
- Page 771 and 772:
Washington Mutual Intra-Day Stock P
- Page 773 and 774:
Washington Mutual Intra-Day Stock P
- Page 775 and 776:
Washington Mutual CDS Prices of New
- Page 777 and 778:
Washington Mutual CDS Transactions
- Page 779 and 780:
Washington Mutual 21(a) Response -
- Page 781 and 782:
Washington Mutual 21(a) Response -
- Page 783 and 784:
Washington Mutual 21(a) Response -
- Page 785 and 786:
Washington Mutual Example 7a: Assen
- Page 787 and 788:
Washington Mutual Example 7c: Assen
- Page 789 and 790:
Summary File Common Stock Transacti
- Page 791 and 792:
Form 424B2 NATIONAL CITY CORP - ncc
- Page 793 and 794:
2013 at a redemption price per shar
- Page 795 and 796:
Table of Contents ABOUT THIS PROSPE
- Page 797 and 798:
Table of Contents SUMMARY This summ
- Page 799:
Table of Contents Dividend Stopper
- Page 802 and 803:
S-4
- Page 804 and 805:
Table of Contents RISK FACTORS An i
- Page 806 and 807:
Table of Contents decline as a resu
- Page 808 and 809:
Table of Contents USE OF PROCEEDS W
- Page 810 and 811:
Table of Contents upon the conversi
- Page 812 and 813:
Table of Contents number of shares
- Page 814 and 815:
Table of Contents not to issue such
- Page 816 and 817:
Table of Contents adjustments to th
- Page 818 and 819:
Table of Contents to authorize, or
- Page 820 and 821:
Table of Contents exercised by the
- Page 822 and 823:
Table of Contents DIRECT REGISTRATI
- Page 824 and 825:
Table of Contents of a partnership
- Page 826 and 827:
Table of Contents in an amount equa
- Page 828 and 829:
Table of Contents Information Repor
- Page 830 and 831:
Table of Contents Plan, or any pers
- Page 832 and 833:
Table of Contents Shares of Series
- Page 834 and 835:
Table of Contents Maximum Number of
- Page 837 and 838:
Table of Contents Shares of Series
- Page 839 and 840:
Table of Contents Shares of Series
- Page 841 and 842:
Table of Contents (1) The “Maximu
- Page 843 and 844:
Table of Contents natural persons t
- Page 845:
Table of Contents Because the selli
- Page 848 and 849:
Table of Contents PLAN OF DISTRIBUT
- Page 850 and 851:
Table of Contents PROSPECTUS Senior
- Page 852 and 853:
Table of Contents ABOUT THIS PROSPE
- Page 854 and 855:
Table of Contents No dealer, salesp
- Page 856 and 857:
Washington, DC 20549-9040 (202) 551
- Page 858 and 859:
Table of Contents CALCULATION OF RE
- Page 860 and 861:
TABLE OF CONTENTS ABOUT THIS PROSPE
- Page 862 and 863:
Table of Contents Risks and uncerta
- Page 864 and 865:
Table of Contents Stock will automa
- Page 867 and 868:
Table of Contents Anti-Dilution Adj
- Page 869 and 870:
Table of Contents Voting Rights Ran
- Page 871 and 872:
Table of Contents The market price
- Page 873 and 874:
Table of Contents The Series G Pref
- Page 875 and 876:
Table of Contents DESCRIPTION OF NA
- Page 877 and 878:
Table of Contents Certificate of De
- Page 879 and 880:
Table of Contents Where, OS 0 = the
- Page 881 and 882:
Table of Contents with a tender or
- Page 883 and 884:
Table of Contents Right to Elect Tw
- Page 885 and 886:
Table of Contents participating, op
- Page 887 and 888:
Table of Contents based on the high
- Page 889 and 890:
Table of Contents CERTAIN U.S. FEDE
- Page 891 and 892:
Table of Contents Stock or our comm
- Page 893 and 894:
Table of Contents other requirement
- Page 895 and 896:
Table of Contents CERTAIN ERISA CON
- Page 897 and 898:
Table of Contents SELLING STOCKHOLD
- Page 899 and 900:
Table of Contents Shares of Series
- Page 901:
Table of Contents Shares of Series
- Page 904 and 905:
Table of Contents Shares of Series
- Page 906 and 907:
Table of Contents Shares of Series
- Page 908 and 909:
(12) Aristeia Capital LLC is the in
- Page 910 and 911:
Table of Contents (22) All of the e
- Page 913 and 914:
Table of Contents Each of SAC Capit
- Page 915 and 916:
Table of Contents EXPERTS The conso
- Page 917 and 918:
TABLE OF CONTENTS Prospectus About
- Page 919 and 920:
Table of Contents You may request a
- Page 921 and 922:
Fallon, Zachary From: Krawitz, Jaco
- Page 923 and 924:
Confidential # Producer How To Use
- Page 925 and 926:
Price $30.00 $25.00 $20.00 $15.00 $
- Page 927 and 928:
Price $20.00 $18.00 $16.00 $14.00 $
- Page 929 and 930:
Price $50.00 $45.00 $40.00 $35.00 $
- Page 931 and 932:
dayn hour _NAME_ AIG_mean AIG_minp
- Page 933 and 934:
10 11 COL1 18.24242 17.62 18.9 1.28
- Page 935 and 936:
18 19 COL1 2.697085 2.58 2.8 0.22 1
- Page 937 and 938:
21.08166 159.9686 159.95 160.03 0.0
- Page 939 and 940:
20.65615 134.4959 130.43 145.89 15.
- Page 941 and 942:
GS_close LEH_meanLEH_minp LEH_maxpL
- Page 943 and 944:
7.766267 7.44 8.2 0.76 1864755 2700
- Page 945 and 946:
142.51 129.8
- Page 947 and 948:
24.59935 24.21 24.9 0.69 0 33850 27
- Page 949 and 950:
18.62415 17.26 19.45 2.19 1793447 3
- Page 951 and 952:
MS_minp MS_maxp MS_rangepMS_tradeb
- Page 953 and 954:
38.08 39.04 0.96 342900 3791667 39.
- Page 955 and 956:
22.81 25.07 2.26 0 176151 39.31129
- Page 957 and 958:
4.0454 26650 4.02 0.12 5/18/1927 16
- Page 959 and 960:
2.17 0.18 15724864 47826532 3.96374
- Page 961 and 962:
MER_shortGS_shorta GS_shortp AIG_sh
- Page 963 and 964:
23.01972 855059 156.7115 5143237 18
- Page 965 and 966:
22.71091 19061 114.533 600 2.75 127
- Page 967 and 968:
2200 6000 100 7200 26800 3.919888 3
- Page 969 and 970:
23916408 2.052039 81053295 38584977
- Page 971 and 972:
Fallon, Zachary From: Edwards, Amy
- Page 973 and 974:
2118 Wilshire Boulevard, #596 Santa
- Page 975 and 976:
SAS Output 20080925 60505724BANK OF
- Page 977 and 978:
SAS Output 20080916 261018105DOWNEY
- Page 979 and 980:
SAS Output 2008091734958B106 FORTRE
- Page 981 and 982:
SAS Output 20080922 493267405KEYCOR
- Page 983 and 984:
SAS Output 20080918 902973882US Ban
- Page 985 and 986:
SAS Output 20080918 929251106W HOLD
- Page 987 and 988:
SAS Output 20080925 939322103WASHIN
- Page 989 and 990:
Fallon, Zachary From: McCormick, Ti
- Page 991 and 992:
arrived, they might borrow real sha
- Page 993 and 994:
friendly relations with its short-s
- Page 995 and 996:
To: Jim Overdahl From: Tim McCormic
- Page 997 and 998:
Figure 1 Percent of Shares Outstand
- Page 999 and 1000:
Figure 3 Percent of Shares Outstand
- Page 1001 and 1002:
Figure 5 Percent of Shares Outstand
- Page 1003 and 1004:
Figure 7 Percent of Shares Outstand
- Page 1005 and 1006:
Figure 9 Percent of Shares Outstand
- Page 1007 and 1008:
• For exchange-listed issues, the
- Page 1009 and 1010:
Table 2 Average Daily Number of Sec
- Page 1011 and 1012:
Table 4 Summary Statistics for Secu
- Page 1013 and 1014:
Reg SHO Pilot Report DRAFT 9/14/200
- Page 1015 and 1016:
Reg SHO Pilot Report DRAFT 9/14/200
- Page 1017 and 1018:
Reg SHO Pilot Report DRAFT 9/14/200
- Page 1019 and 1020:
Reg SHO Pilot Report DRAFT 9/14/200
- Page 1021 and 1022:
Reg SHO Pilot Report DRAFT 9/14/200
- Page 1023 and 1024:
Reg SHO Pilot Report DRAFT 9/14/200
- Page 1025 and 1026:
Reg SHO Pilot Report DRAFT 9/14/200
- Page 1027 and 1028:
Reg SHO Pilot Report DRAFT 9/14/200
- Page 1029 and 1030:
Reg SHO Pilot Report DRAFT 9/14/200
- Page 1031 and 1032:
Reg SHO Pilot Report DRAFT 9/14/200
- Page 1033 and 1034:
Reg SHO Pilot Report DRAFT 9/14/200
- Page 1035 and 1036:
Reg SHO Pilot Report DRAFT 9/14/200
- Page 1037 and 1038:
Reg SHO Pilot Report DRAFT 9/14/200
- Page 1039 and 1040:
Reg SHO Pilot Report DRAFT 9/14/200
- Page 1041 and 1042:
Reg SHO Pilot Report DRAFT 9/14/200
- Page 1043 and 1044:
Reg SHO Pilot Report DRAFT 9/14/200
- Page 1045 and 1046:
Reg SHO Pilot Report DRAFT 9/14/200
- Page 1047 and 1048:
Reg SHO Pilot Report DRAFT 9/14/200
- Page 1049 and 1050:
Reg SHO Pilot Report DRAFT 9/14/200
- Page 1051 and 1052:
Reg SHO Pilot Report DRAFT 9/14/200
- Page 1053 and 1054:
Reg SHO Pilot Report DRAFT 9/14/200
- Page 1055 and 1056:
Reg SHO Pilot Report DRAFT 9/14/200
- Page 1057 and 1058:
Reg SHO Pilot Report DRAFT 9/14/200
- Page 1059 and 1060:
Reg SHO Pilot Report DRAFT 9/14/200
- Page 1061 and 1062:
Reg SHO Pilot Report DRAFT 9/14/200
- Page 1063 and 1064:
Reg SHO Pilot Report DRAFT 9/14/200
- Page 1065 and 1066:
Reg SHO Pilot Report DRAFT 9/14/200
- Page 1067 and 1068:
Reg SHO Pilot Report DRAFT 9/14/200
- Page 1069 and 1070:
Reg SHO Pilot Report DRAFT 9/14/200
- Page 1071 and 1072:
Reg SHO Pilot Report DRAFT 9/14/200
- Page 1073 and 1074:
Reg SHO Pilot Report DRAFT 9/14/200
- Page 1075 and 1076:
Reg SHO Pilot Report DRAFT 9/14/200
- Page 1077 and 1078:
Reg SHO Pilot Report DRAFT 9/14/200
- Page 1079 and 1080:
Reg SHO Pilot Report DRAFT 9/14/200
- Page 1081 and 1082:
Reg SHO Pilot Report DRAFT 9/14/200
- Page 1083 and 1084:
Reg SHO Pilot Report DRAFT 9/14/200
- Page 1085 and 1086:
Reg SHO Pilot Report DRAFT 9/14/200
- Page 1087 and 1088:
Reg SHO Pilot Report DRAFT 9/14/200
- Page 1089 and 1090:
Reg SHO Pilot Report DRAFT 9/14/200
- Page 1091 and 1092:
Reg SHO Pilot Report DRAFT 9/14/200
- Page 1093 and 1094:
Reg SHO Pilot Report DRAFT 9/14/200
- Page 1095 and 1096:
Reg SHO Pilot Report DRAFT 9/14/200
- Page 1097 and 1098:
Reg SHO Pilot Report DRAFT 9/14/200
- Page 1099 and 1100:
Reg SHO Pilot Report DRAFT 9/14/200
- Page 1101 and 1102:
permanent the relevant provisions o
- Page 1103 and 1104:
• The average daily dollar value
- Page 1105 and 1106:
Table 1 Summary Statistics on Fails
- Page 1107 and 1108:
Table 3 Summary Statistics on Fails
- Page 1109 and 1110:
2.5 2 1.5 1 0.5 0 20040401 20040825
- Page 1111 and 1112:
700 600 500 400 300 200 100 0 20050
- Page 1113 and 1114:
3 2.5 2 1.5 1 0.5 0 Figure 5 Fails
- Page 1115 and 1116:
2 1.5 1 0.5 0 Figure 7 Fails to Del
- Page 1117 and 1118:
Fail Category Settlement Days to Cl
- Page 1119 and 1120:
Reg SHO Pilot Report 2/12/2007 Tabl
- Page 1121 and 1122:
Reg SHO Pilot Report 2/12/2007 In J
- Page 1123 and 1124:
Reg SHO Pilot Report 2/12/2007 grou
- Page 1125 and 1126:
Reg SHO Pilot Report 2/12/2007 pilo
- Page 1127 and 1128:
Reg SHO Pilot Report 2/12/2007 Thir
- Page 1129 and 1130:
Reg SHO Pilot Report 2/12/2007 II H
- Page 1131 and 1132:
Reg SHO Pilot Report 2/12/2007 In 1
- Page 1133 and 1134:
Reg SHO Pilot Report 2/12/2007 With
- Page 1135 and 1136:
Reg SHO Pilot Report 2/12/2007 stoc
- Page 1137 and 1138:
Reg SHO Pilot Report 2/12/2007 This
- Page 1139 and 1140:
Reg SHO Pilot Report 2/12/2007 rule
- Page 1141 and 1142:
Reg SHO Pilot Report 2/12/2007 Simi
- Page 1143 and 1144:
Reg SHO Pilot Report 2/12/2007 The
- Page 1145 and 1146:
Reg SHO Pilot Report 2/12/2007 V Me
- Page 1147 and 1148:
Reg SHO Pilot Report 2/12/2007 R =
- Page 1149 and 1150:
Reg SHO Pilot Report 2/12/2007 dist
- Page 1151 and 1152:
Reg SHO Pilot Report 2/12/2007 acti
- Page 1153 and 1154:
Reg SHO Pilot Report 2/12/2007 Stoc
- Page 1155 and 1156:
Reg SHO Pilot Report 2/12/2007 side
- Page 1157 and 1158:
Reg SHO Pilot Report 2/12/2007 Stoc
- Page 1159 and 1160:
Reg SHO Pilot Report 2/12/2007 toge
- Page 1161 and 1162:
Reg SHO Pilot Report 2/12/2007 incr
- Page 1163 and 1164:
Reg SHO Pilot Report 2/12/2007 day
- Page 1165 and 1166:
Reg SHO Pilot Report 2/12/2007 mani
- Page 1167 and 1168:
Reg SHO Pilot Report 2/12/2007 pilo
- Page 1169 and 1170:
Reg SHO Pilot Report 2/12/2007 marg
- Page 1171 and 1172:
Reg SHO Pilot Report 2/12/2007 acti
- Page 1173 and 1174:
Reg SHO Pilot Report 2/12/2007 lowe
- Page 1175 and 1176:
Reg SHO Pilot Report 2/12/2007 Refe
- Page 1177 and 1178:
Reg SHO Pilot Report 2/12/2007 Tabl
- Page 1179 and 1180:
Reg SHO Pilot Report 2/12/2007 Tabl
- Page 1181 and 1182:
Reg SHO Pilot Report 2/12/2007 Tabl
- Page 1183 and 1184:
Reg SHO Pilot Report 2/12/2007 Tabl
- Page 1185 and 1186:
Reg SHO Pilot Report 2/12/2007 Tabl
- Page 1187 and 1188:
Reg SHO Pilot Report 2/12/2007 Tabl
- Page 1189 and 1190:
Reg SHO Pilot Report 2/12/2007 Tabl
- Page 1191 and 1192:
Reg SHO Pilot Report 2/12/2007 Tabl
- Page 1193 and 1194:
Reg SHO Pilot Report 2/12/2007 Tabl
- Page 1195 and 1196:
Reg SHO Pilot Report 2/12/2007 Tabl
- Page 1197 and 1198:
Reg SHO Pilot Report 2/12/2007 Tabl
- Page 1199 and 1200:
Reg SHO Pilot Report 2/12/2007 Tabl
- Page 1201 and 1202:
Reg SHO Pilot Report 2/12/2007 Figu
- Page 1203 and 1204:
Reg SHO Pilot Report 2/12/2007 Tabl
- Page 1205 and 1206:
Reg SHO Pilot Report 2/12/2007 Stud
- Page 1207 and 1208:
TO: File FROM: Office of Economic A
- Page 1209 and 1210:
• The average daily number of opt
- Page 1211 and 1212:
Table 2 Summary Statistics on Fails
- Page 1213 and 1214:
provides for a 35-settlement day ph
- Page 1215 and 1216:
• The average daily number of fai
- Page 1217 and 1218:
Table 1 Summary Statistics on Fails
- Page 1219 and 1220:
Table 3 Summary Statistics on Fails
- Page 1221 and 1222:
2.5 2 1.5 1 0.5 0 20040401 20040825
- Page 1223 and 1224:
700 600 500 400 300 200 100 0 20050
- Page 1225 and 1226:
2.5 2 1.5 1 0.5 0 20080602 20080616
- Page 1227 and 1228:
1.6 1.4 1.2 1 0.8 0.6 0.4 0.2 0 200
- Page 1229 and 1230:
TO: File FROM: Office of Economic A
- Page 1231 and 1232:
All Securities (Table 1): Table 1 s
- Page 1233 and 1234:
Daily Fails to Deliver in All Secur
- Page 1235 and 1236:
Table 2 Summary Statistics on Fails
- Page 1237 and 1238:
Table 4 Summary Statistics on Fails
- Page 1239 and 1240:
700 600 500 400 300 200 100 0 0501
- Page 1241 and 1242:
1.4 1.2 1 0.8 0.6 0.4 0.2 0 2005010
- Page 1243 and 1244:
700 600 500 400 300 200 100 0 20080
- Page 1245 and 1246:
Number of Threshold Securities 700
- Page 1247 and 1248:
TO: File FROM: Office of Economic A
- Page 1249 and 1250:
• The average daily number of fai
- Page 1251 and 1252:
Daily Number of Threshold List Secu
- Page 1253 and 1254:
Table 2 Summary Statistics on Fails
- Page 1255 and 1256:
Table 4 Summary Statistics on Fails
- Page 1257 and 1258:
700 600 500 400 300 200 100 0 0501
- Page 1259 and 1260:
1.4 1.2 1 0.8 0.6 0.4 0.2 0 2005010
- Page 1261 and 1262:
700 600 500 400 300 200 100 0 20080
- Page 1263 and 1264:
Fail Category Settlement Days to Cl
- Page 1265 and 1266:
Short Selling in Initial Public Off
- Page 1267 and 1268:
delay, as previously thought. Short
- Page 1269 and 1270:
threshold list on the first possibl
- Page 1271 and 1272:
Both Geczy, Musto and Reed (2002) a
- Page 1273 and 1274:
esponsible for the Internet bubble.
- Page 1275 and 1276:
on periods during the tech bubble.
- Page 1277 and 1278:
trading although the levels are qui
- Page 1279 and 1280:
in offer price as measured as the p
- Page 1281 and 1282:
ule allows short sales to execute a
- Page 1283 and 1284:
negative and occasionally significa
- Page 1285 and 1286:
SROs daily for stocks that have agg
- Page 1287 and 1288:
place it on a list known as the Reg
- Page 1289 and 1290:
order to provide price support. Agg
- Page 1291 and 1292:
Panel B of Table 6 presents the det
- Page 1293 and 1294:
In focusing on the potential short
- Page 1295 and 1296:
During our sample period, Regulatio
- Page 1297 and 1298:
The perceived inability of short se
- Page 1299 and 1300:
References Aggarwal, Reena and Pat
- Page 1301 and 1302:
Houge, Todd, Tim Loughran, Gerry Su
- Page 1303 and 1304:
Table 2 Comparison of First Day Tra
- Page 1305 and 1306:
Table 4 Summary Statistics on Fails
- Page 1307 and 1308:
Variable Table 6 Determinants of Lo
- Page 1309 and 1310:
Table 8 Short Term Price Effects Th
- Page 1311 and 1312:
Figure 1 Distribution of Short Sell
- Page 1313 and 1314:
Figure 3 Short Selling, Returns and
- Page 1315:
Figure 5 Short Selling and Failures
Inappropriate
Loading...
Inappropriate
You have already flagged this document.
Thank you, for helping us keep this platform clean.
The editors will have a look at it as soon as possible.
Mail this publication
Loading...
Embed
Loading...
Delete template?
Are you sure you want to delete your template?
DOWNLOAD ePAPER
This ePaper is currently not available for download.
You can find similar magazines on this topic below under ‘Recommendations’.