SEC Form 20-F - Deutsche Bank Annual Report 2012
SEC Form 20-F - Deutsche Bank Annual Report 2012
SEC Form 20-F - Deutsche Bank Annual Report 2012

You also want an ePaper? Increase the reach of your titles
YUMPU automatically turns print PDFs into web optimized ePapers that Google loves.
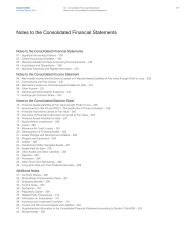
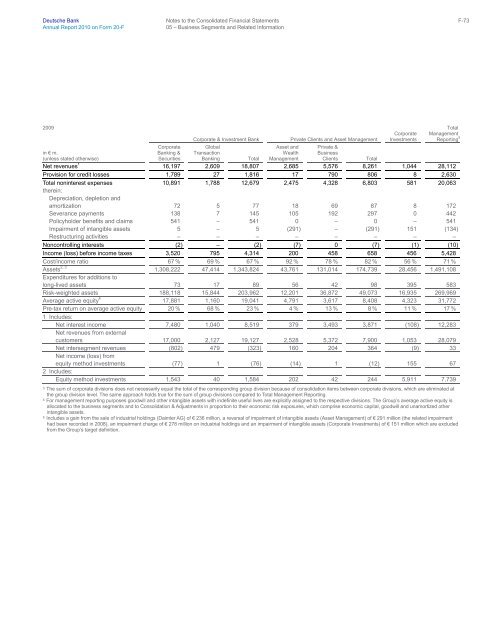
<strong>Deutsche</strong> <strong>Bank</strong> Notes to the Consolidated Financial Statements F-73<br />
<strong>Annual</strong> <strong>Report</strong> <strong>20</strong>10 on <strong>Form</strong> <strong>20</strong>-F 05 – Business Segments and Related Information<br />
<strong>20</strong>09<br />
in € m.<br />
(unless stated otherwise)<br />
Corporate<br />
<strong>Bank</strong>ing &<br />
Securities<br />
Corporate & Investment <strong>Bank</strong> Private Clients and Asset Management<br />
Global<br />
Transaction<br />
<strong>Bank</strong>ing Total<br />
Asset and<br />
Wealth<br />
Management<br />
Private &<br />
Business<br />
Clients Total<br />
Corporate<br />
Investments<br />
Total<br />
Management<br />
<strong>Report</strong>ing 5<br />
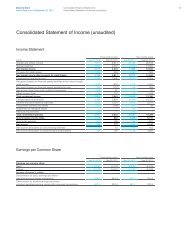
Net revenues 1 16,197 2,609 18,807 2,685 5,576 8,261 1,044 28,112<br />
Provision for credit losses 1,789 27 1,816 17 790 806 8 2,630<br />
Total noninterest expenses<br />
therein:<br />
Depreciation, depletion and<br />
10,891 1,788 12,679 2,475 4,328 6,803 581 <strong>20</strong>,063<br />
amortization 72 5 77 18 69 87 8 172<br />
Severance payments 138 7 145 105 192 297 0 442<br />
Policyholder benefits and claims 541 – 541 0 – 0 – 541<br />
Impairment of intangible assets 5 – 5 (291) – (291) 151 (134)<br />
Restructuring activities – – – – – – – –<br />
Noncontrolling interests (2) – (2) (7) 0 (7) (1) (10)<br />
Income (loss) before income taxes 3,5<strong>20</strong> 795 4,314 <strong>20</strong>0 458 658 456 5,428<br />
Cost/income ratio 67 % 69 % 67 % 92 % 78 % 82 % 56 % 71 %<br />
Assets 2, 3 Expenditures for additions to<br />
1,308,222 47,414 1,343,824 43,761 131,014 174,739 28,456 1,491,108<br />
long-lived assets 73 17 89 56 42 98 395 583<br />
Risk-weighted assets 188,118 15,844 <strong>20</strong>3,962 12,<strong>20</strong>1 36,872 49,073 16,935 269,969<br />
Average active equity 4 17,881 1,160 19,041 4,791 3,617 8,408 4,323 31,772<br />
Pre-tax return on average active equity<br />
1 Includes:<br />
<strong>20</strong> % 68 % 23 % 4 % 13 % 8 % 11 % 17 %<br />
Net interest income<br />
Net revenues from external<br />
7,480 1,040 8,519 379 3,493 3,871 (108) 12,283<br />
customers 17,000 2,127 19,127 2,528 5,372 7,900 1,053 28,079<br />
Net intersegment revenues<br />
Net income (loss) from<br />
(802) 479 (323) 160 <strong>20</strong>4 364 (9) 33<br />
equity method investments<br />
2 Includes:<br />
(77) 1 (76) (14) 1 (12) 155 67<br />
Equity method investments 1,543 40 1,584 <strong>20</strong>2 42 244 5,911 7,739<br />
3 The sum of corporate divisions does not necessarily equal the total of the corresponding group division because of consolidation items between corporate divisions, which are eliminated at<br />
the group division level. The same approach holds true for the sum of group divisions compared to Total Management <strong>Report</strong>ing.<br />
4 For management reporting purposes goodwill and other intangible assets with indefinite useful lives are explicitly assigned to the respective divisions. The Group’s average active equity is<br />
allocated to the business segments and to Consolidation & Adjustments in proportion to their economic risk exposures, which comprise economic capital, goodwill and unamortized other<br />
intangible assets.<br />
5 Includes a gain from the sale of industrial holdings (Daimler AG) of € 236 million, a reversal of impairment of intangible assets (Asset Management) of € 291 million (the related impairment<br />
had been recorded in <strong>20</strong>08), an impairment charge of € 278 million on industrial holdings and an impairment of intangible assets (Corporate Investments) of € 151 million which are excluded<br />
from the Group’s target definition.