SEC Form 20-F - Deutsche Bank Annual Report 2012
SEC Form 20-F - Deutsche Bank Annual Report 2012
SEC Form 20-F - Deutsche Bank Annual Report 2012
Create successful ePaper yourself
Turn your PDF publications into a flip-book with our unique Google optimized e-Paper software.
<strong>Deutsche</strong> <strong>Bank</strong><br />
<strong>Annual</strong> <strong>Report</strong> <strong>20</strong>10 on <strong>Form</strong> <strong>20</strong>-F<br />
Item 5: Operating and Financial Review and Prospects 56<br />
Financial Results<br />
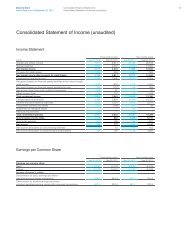
The following table presents our condensed consolidated statement of income for <strong>20</strong>10, <strong>20</strong>09 and <strong>20</strong>08.<br />
in € m.<br />
(unless stated otherwise) <strong>20</strong>10 <strong>20</strong>09 <strong>20</strong>08<br />
<strong>20</strong>10 increase (decrease)<br />
from <strong>20</strong>09<br />
<strong>20</strong>09 increase (decrease)<br />
from <strong>20</strong>08<br />
in € m. in % in € m. in %<br />
Net interest income 15,583 12,459 12,453 3,124 25 6 0<br />
Provision for credit losses 1,274 2,630 1,076 (1,356) (52) 1,554 144<br />
Net interest income after provision for credit<br />
losses 14,309 9,829 11,377 4,480 46 (1,548) (14)<br />
Commissions and fee income 10,669 8,911 9,741 1,758 <strong>20</strong> (830) (9)<br />
Net gains (losses) on financial assets/liabilities<br />
at fair value through profit or loss 3,354 7,109 (9,992) (3,755) (53) 17,101 N/M<br />
Net gains (losses) on financial assets<br />
available for sale <strong>20</strong>1 (403) 666 604 N/M (1,069) N/M<br />
Net income (loss) from equity method<br />
investments (2,004) 59 46 (2,063) N/M 13 28<br />
Other income (loss) 764 (183) 699 947 N/M (882) N/M<br />
Total noninterest income 12,984 15,493 1,160 (2,509) (16) 14,333 N/M<br />
Total net revenues 27,293 25,322 12,537 1,971 8 12,785 102<br />
Compensation and benefits 12,671 11,310 9,606 1,361 12 1,704 18<br />
General and administrative expenses 10,133 8,402 8,339 1,731 21 63 1<br />
Policyholder benefits and claims 485 542 (252) (57) (11) 794 N/M<br />
Impairment of intangible assets 29 (134) 585 163 N/M (719) N/M<br />
Restructuring activities – – – – N/M – N/M<br />
Total noninterest expenses 23,318 <strong>20</strong>,1<strong>20</strong> 18,278 3,198 16 1,842 10<br />
Income (loss) before income taxes 3,975 5,<strong>20</strong>2 (5,741) (1,227) (24) 10,943 N/M<br />
Income tax expense (benefit) 1,645 244 (1,845) 1,401 N/M 2,089 N/M<br />
Net income (loss) 2,330 4,958 (3,896) (2,628) (53) 8,854 N/M<br />
Net income (loss) attributable to<br />
noncontrolling interests <strong>20</strong> (15) (61) 35 N/M 46 (75)<br />
Net income (loss) attributable to<br />
<strong>Deutsche</strong> <strong>Bank</strong> shareholders 2,310 4,973 (3,835) (2,663) (54) 8,808 N/M<br />
N/M – Not meaningful<br />
Net Interest Income<br />
The following table sets forth data related to our Net interest income.<br />
in € m.<br />
(unless stated otherwise) <strong>20</strong>10 <strong>20</strong>09 <strong>20</strong>08<br />
<strong>20</strong>10 increase (decrease)<br />
from <strong>20</strong>09<br />
<strong>20</strong>09 increase (decrease)<br />
from <strong>20</strong>08<br />
in € m. in % in € m. in %<br />
Total interest and similar income 28,779 26,953 54,549 1,826 7 (27,596) (51)<br />
Total interest expenses 13,196 14,494 42,096 (1,298) (9) (27,602) (66)<br />
Net interest income 15,583 12,459 12,453 3,124 25 6 0<br />
Average interest-earning assets 1 993,780 879,601 1,216,666 114,179 13 (337,065) (28)<br />
Average interest-bearing liabilities 1 933,537 853,383 1,179,631 80,154 9 (326,248) (28)<br />
Gross interest yield 2 2.90 % 3.06 % 4.48 % (0.16) ppt (5) (1.42) ppt (32)<br />
Gross interest rate paid 3 1.41 % 1.70 % 3.57 % (0.29) ppt (17) (1.87) ppt (52)<br />
Net interest spread 4 1.48 % 1.37 % 0.91 % 0.11 ppt 8 0.46 ppt 51<br />
Net interest margin 5 ppt – Percentage points<br />
1.57 % 1.42 % 1.02 % 0.15 ppt 11 0.40 ppt 39<br />
1 Average balances for each year are calculated in general based upon month-end balances.<br />
2 Gross interest yield is the average interest rate earned on our average interest-earning assets.<br />
3 Gross interest rate paid is the average interest rate paid on our average interest-bearing liabilities.<br />
4 Net interest spread is the difference between the average interest rate earned on average interest-earning assets and the average interest rate paid on average<br />
interest-bearing liabilities.<br />
5 Net interest margin is net interest income expressed as a percentage of average interest-earning assets.


