SEC Form 20-F - Deutsche Bank Annual Report 2012
SEC Form 20-F - Deutsche Bank Annual Report 2012
SEC Form 20-F - Deutsche Bank Annual Report 2012

You also want an ePaper? Increase the reach of your titles
YUMPU automatically turns print PDFs into web optimized ePapers that Google loves.
<strong>Deutsche</strong> <strong>Bank</strong><br />
<strong>Annual</strong> <strong>Report</strong> <strong>20</strong>10 on <strong>Form</strong> <strong>20</strong>-F<br />
Item 5: Operating and Financial Review and Prospects 58<br />
Net Interest Income and Net Gains (Losses) on Financial Assets/Liabilities at Fair Value through<br />
Profit or Loss<br />
Our trading and risk management businesses include significant activities in interest rate instruments and<br />
related derivatives. Under IFRS, interest and similar income earned from trading instruments and financial<br />
instruments designated at fair value through profit or loss (e.g., coupon and dividend income), and the costs of<br />
funding net trading positions are part of net interest income. Our trading activities can periodically shift income<br />
between net interest income and net gains (losses) on financial assets/liabilities at fair value through profit or<br />
loss depending on a variety of factors, including risk management strategies.<br />
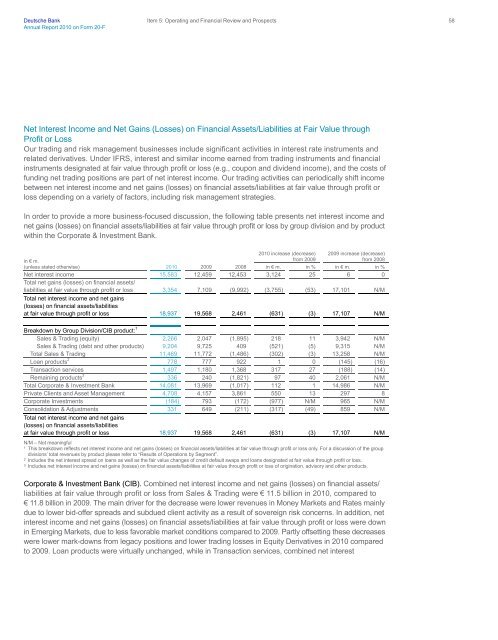
In order to provide a more business-focused discussion, the following table presents net interest income and<br />
net gains (losses) on financial assets/liabilities at fair value through profit or loss by group division and by product<br />
within the Corporate & Investment <strong>Bank</strong>.<br />
in € m.<br />
(unless stated otherwise) <strong>20</strong>10 <strong>20</strong>09 <strong>20</strong>08<br />
<strong>20</strong>10 increase (decrease)<br />
from <strong>20</strong>09<br />
<strong>20</strong>09 increase (decrease)<br />
from <strong>20</strong>08<br />
in € m. in % in € m. in %<br />
Net interest income 15,583 12,459 12,453 3,124 25 6 0<br />
Total net gains (losses) on financial assets/<br />
liabilities at fair value through profit or loss 3,354 7,109 (9,992) (3,755) (53) 17,101 N/M<br />
Total net interest income and net gains<br />
(losses) on financial assets/liabilities<br />
at fair value through profit or loss 18,937 19,568 2,461 (631) (3) 17,107 N/M<br />
Breakdown by Group Division/CIB product: 1<br />
Sales & Trading (equity) 2,266 2,047 (1,895) 218 11 3,942 N/M<br />
Sales & Trading (debt and other products) 9,<strong>20</strong>4 9,725 409 (521) (5) 9,315 N/M<br />
Total Sales & Trading 11,469 11,772 (1,486) (302) (3) 13,258 N/M<br />
Loan products 2 778 777 922 1 0 (145) (16)<br />
Transaction services 1,497 1,180 1,368 317 27 (188) (14)<br />
Remaining products 3 336 240 (1,821) 97 40 2,061 N/M<br />
Total Corporate & Investment <strong>Bank</strong> 14,081 13,969 (1,017) 112 1 14,986 N/M<br />
Private Clients and Asset Management 4,708 4,157 3,861 550 13 297 8<br />
Corporate Investments (184) 793 (172) (977) N/M 965 N/M<br />
Consolidation & Adjustments 331 649 (211) (317) (49) 859 N/M<br />
Total net interest income and net gains<br />
(losses) on financial assets/liabilities<br />
at fair value through profit or loss 18,937 19,568 2,461 (631) (3) 17,107 N/M<br />
N/M – Not meaningful<br />
1 This breakdown reflects net interest income and net gains (losses) on financial assets/liabilities at fair value through profit or loss only. For a discussion of the group<br />
divisions’ total revenues by product please refer to “Results of Operations by Segment”.<br />
2 Includes the net interest spread on loans as well as the fair value changes of credit default swaps and loans designated at fair value through profit or loss.<br />
3 Includes net interest income and net gains (losses) on financial assets/liabilities at fair value through profit or loss of origination, advisory and other products.<br />
Corporate & Investment <strong>Bank</strong> (CIB). Combined net interest income and net gains (losses) on financial assets/<br />
liabilities at fair value through profit or loss from Sales & Trading were € 11.5 billion in <strong>20</strong>10, compared to<br />
€ 11.8 billion in <strong>20</strong>09. The main driver for the decrease were lower revenues in Money Markets and Rates mainly<br />
due to lower bid-offer spreads and subdued client activity as a result of sovereign risk concerns. In addition, net<br />
interest income and net gains (losses) on financial assets/liabilities at fair value through profit or loss were down<br />
in Emerging Markets, due to less favorable market conditions compared to <strong>20</strong>09. Partly offsetting these decreases<br />
were lower mark-downs from legacy positions and lower trading losses in Equity Derivatives in <strong>20</strong>10 compared<br />
to <strong>20</strong>09. Loan products were virtually unchanged, while in Transaction services, combined net interest