SEC Form 20-F - Deutsche Bank Annual Report 2012
SEC Form 20-F - Deutsche Bank Annual Report 2012
SEC Form 20-F - Deutsche Bank Annual Report 2012

You also want an ePaper? Increase the reach of your titles
YUMPU automatically turns print PDFs into web optimized ePapers that Google loves.
<strong>Deutsche</strong> <strong>Bank</strong><br />
<strong>Annual</strong> <strong>Report</strong> <strong>20</strong>10 on <strong>Form</strong> <strong>20</strong>-F<br />
Item 5: Operating and Financial Review and Prospects 60<br />
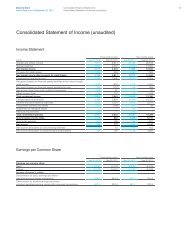
Remaining Noninterest Income<br />
The following table sets forth information on our Remaining noninterest income.<br />
in € m.<br />
(unless stated otherwise) <strong>20</strong>10 <strong>20</strong>09 <strong>20</strong>08<br />
<strong>20</strong>10 increase (decrease)<br />
from <strong>20</strong>09<br />
<strong>20</strong>09 increase (decrease)<br />
from <strong>20</strong>08<br />
in € m. in % in € m. in %<br />
Commissions and fee income 1 10,669 8,911 9,741 1,758 <strong>20</strong> (830) (9)<br />
Net gains (losses) on financial assets<br />
available for sale <strong>20</strong>1 (403) 666 604 N/M (1,069) N/M<br />
Net income (loss) from equity method<br />
investments (2,004) 59 46 (2,063) N/M 13 28<br />
Other income (loss) 764 (183) 699 947 N/M (882) N/M<br />
Total remaining noninterest income 9,630 8,384 11,152 1,246 15 (2,768) (25)<br />
N/M – Not meaningful<br />
1<br />
includes:<br />
<strong>20</strong>10 <strong>20</strong>09 <strong>20</strong>08 in € m. in % in € m. in %<br />
Commissions and fees from fiduciary<br />
activities:<br />
Commissions for administration<br />
Commissions for assets under<br />
491 392 384 99 25 8 2<br />
management 2,833 2,319 2,815 514 22 (496) (18)<br />
Commissions for other securities business <strong>20</strong>5 214 215 (9) (4) (1) (0)<br />
Total<br />
Commissions, broker’s fees, mark-ups on<br />
securities underwriting and other securities<br />
activities:<br />
3,529 2,925 3,414 604 21 (489) (14)<br />
Underwriting and advisory fees 2,148 1,767 1,341 381 22 426 32<br />
Brokerage fees 1,725 1,682 2,449 43 3 (767) (31)<br />
Total 3,873 3,449 3,790 424 12 (341) (9)<br />
Fees for other customer services 3,267 2,537 2,537 730 29 0 0<br />
Total commissions and fee income 10,669 8,911 9,741 1,758 <strong>20</strong> (830) (9)<br />
N/M – Not meaningful<br />
Commissions and fee income. Total commissions and fee income was € 10.7 billion in <strong>20</strong>10, an increase of<br />
€ 1.8 billion, or <strong>20</strong> %, compared to <strong>20</strong>09. Commissions and fees from fiduciary activities increased € 604 million<br />
compared to the prior year, driven by higher asset based fees and performance fees in AM. Underwriting and<br />
advisory fees improved by € 381 million, or 22 %, mainly from a number of large initial public offerings (IPOs).<br />
Brokerage fees increased by € 43 million, or 3 %, primarily driven by the first-time consolidation of Sal. Oppenheim/<br />
BHF-BANK as well as a stronger performance in PBC compared to the prior year. This positive development is<br />
partly offset by a decrease in CB&S. Fees for other customer services were up by € 730 million, or 29 %, from<br />
increased business activity.<br />
Net gains (losses) on financial assets available for sale. Net gains on financial assets available for sale were<br />
€ <strong>20</strong>1 million in <strong>20</strong>10, versus net losses of € 403 million in <strong>20</strong>09. The gains in <strong>20</strong>10 mainly resulted from the sale<br />
of Axel Springer AG shares in CB&S, which had been pledged as loan collateral, and from the disposal of an<br />
available for sale security position in PBC. The losses in <strong>20</strong>09 were primarily attributable to impairment charges<br />
related to investments in CB&S and to AM’s real estate business.<br />
Net income (loss) from equity method investments. Net loss from equity method investments was € 2.0 billion<br />
in <strong>20</strong>10 versus a net gain of € 59 million in <strong>20</strong>09. The net loss in <strong>20</strong>10 included a charge of € 2.3 billion, partly<br />
offset by a positive equity pick-up, both related to our investment in Postbank. In <strong>20</strong>09, the net income from<br />
equity method investments included gains from our investment in Postbank, partly offset by impairment<br />
charges on certain equity method investments in our commercial real estate business in CB&S.