- Page 1 and 2:
NATIONAL INSTITUTE ON DRUG ABUSE EP
- Page 3: Foreword This publication includes
- Page 6 and 7: EPIDEMIOLOGIC TRENDS IN DRUG ABUSE
- Page 8 and 9: 2 EPIDEMIOLOGIC TRENDS IN DRUG ABUS
- Page 11: Epidemiology of Drug Abuse: CEWG Ar
- Page 14 and 15: • The city of Atlanta has become
- Page 16 and 17: In the first 6 months of 2004, trea
- Page 18 and 19: eports (exhibit 2), while African-A
- Page 20 and 21: population) than in 2002 (17.2 per
- Page 22 and 23: 16 EPIDEMIOLOGIC TRENDS IN DRUG ABU
- Page 24 and 25: EPIDEMIOLOGIC TRENDS IN DRUG ABUSE
- Page 26 and 27: data from the Drug Abuse Warning Ne
- Page 28 and 29: than age 18, compared to 4 percent
- Page 30 and 31: More often than not, marijuana use
- Page 32 and 33: Solomon, L.; Flynn, C.; Muck, K.; e
- Page 34 and 35: 28 EPIDEMIOLOGIC TRENDS IN DRUG ABU
- Page 36 and 37: 30 EPIDEMIOLOGIC TRENDS IN DRUG ABU
- Page 38 and 39: 32 EPIDEMIOLOGIC TRENDS IN DRUG ABU
- Page 40 and 41: 34 EPIDEMIOLOGIC TRENDS IN DRUG ABU
- Page 42 and 43: 36 EPIDEMIOLOGIC TRENDS IN DRUG ABU
- Page 44 and 45: • Logan International Airport and
- Page 46 and 47: In 2002, heroin/morphine was indica
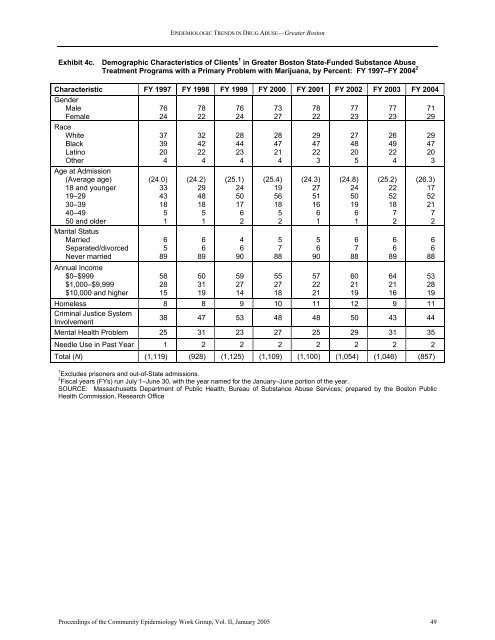
- Page 48 and 49: The FY 2004 racial distribution for
- Page 50 and 51: 44 EPIDEMIOLOGIC TRENDS IN DRUG ABU
- Page 52 and 53: 46 EPIDEMIOLOGIC TRENDS IN DRUG ABU
- Page 56 and 57: 50 EPIDEMIOLOGIC TRENDS IN DRUG ABU
- Page 58 and 59: • Emergency department (ED) drug
- Page 60 and 61: monly mentioned secondary drug amon
- Page 62 and 63: Between 2001 and 2003, the Illinois
- Page 64 and 65: In the NIHU Study, 20 percent of pa
- Page 66 and 67: Ecstasy remained available in most
- Page 68 and 69: 62 EPIDEMIOLOGIC TRENDS IN DRUG ABU
- Page 70 and 71: EPIDEMIOLOGIC TRENDS IN DRUG ABUSE
- Page 72 and 73: 66 and analyzed by the Division of
- Page 74 and 75: ounce in the Denver metropolitan ar
- Page 76 and 77: 18 at the time of admission to trea
- Page 78 and 79: Injecting had been the most common
- Page 80 and 81: alcohol; 651 involved alcohol-in-co
- Page 82 and 83: 76 EPIDEMIOLOGIC TRENDS IN DRUG ABU
- Page 84 and 85: 78 EPIDEMIOLOGIC TRENDS IN DRUG ABU
- Page 86 and 87: 80 EPIDEMIOLOGIC TRENDS IN DRUG ABU
- Page 88 and 89: 82 EPIDEMIOLOGIC TRENDS IN DRUG ABU
- Page 90 and 91: The economy in Hawai'i, after a dec
- Page 92 and 93: Methamphetamine remains the leading
- Page 94 and 95: methamphetamine, representing 76.5
- Page 96 and 97: Of interest in this chart is the ag
- Page 98 and 99: 92 EPIDEMIOLOGIC TRENDS IN DRUG ABU
- Page 100 and 101: 94 EPIDEMIOLOGIC TRENDS IN DRUG ABU
- Page 102 and 103: EPIDEMIOLOGIC TRENDS IN DRUG ABUSE
- Page 104 and 105:
98 weighted DAWN data released by S
- Page 106 and 107:
A total of 5,425 cocaine arrests wa
- Page 108 and 109:
data, however, rising from 1.5 perc
- Page 110 and 111:
According to NDIC, California and M
- Page 112 and 113:
and 15 items were identified as pse
- Page 114 and 115:
most frequently reported secondary
- Page 116 and 117:
esidents are living with advanced H
- Page 118 and 119:
112 EPIDEMIOLOGIC TRENDS IN DRUG AB
- Page 120 and 121:
114 EPIDEMIOLOGIC TRENDS IN DRUG AB
- Page 122 and 123:
116 EPIDEMIOLOGIC TRENDS IN DRUG AB
- Page 124 and 125:
118 EPIDEMIOLOGIC TRENDS IN DRUG AB
- Page 126 and 127:
120 EPIDEMIOLOGIC TRENDS IN DRUG AB
- Page 128 and 129:
(DAWN) that monitors emergency depa
- Page 130 and 131:
Beginning in 2003, SAMHSA’s natio
- Page 132 and 133:
65 percent were older than 34. The
- Page 134 and 135:
the 1,198 drug abuse ED reports in
- Page 136 and 137:
“Crystal” or smokeable methamph
- Page 138 and 139:
132 EPIDEMIOLOGIC TRENDS IN DRUG AB
- Page 140 and 141:
134 EPIDEMIOLOGIC TRENDS IN DRUG AB
- Page 142 and 143:
EPIDEMIOLOGIC TRENDS IN DRUG ABUSE
- Page 144 and 145:
tion was injection (62.9 percent),
- Page 146 and 147:
included reports of ED cases involv
- Page 148 and 149:
142 EPIDEMIOLOGIC TRENDS IN DRUG AB
- Page 150 and 151:
144 EPIDEMIOLOGIC TRENDS IN DRUG AB
- Page 152 and 153:
From November 10 to 16, 2004, 18 me
- Page 154 and 155:
NFLIS between October 2003 and Sept
- Page 156 and 157:
from 12.2 percent in the first half
- Page 158 and 159:
152 EPIDEMIOLOGIC TRENDS IN DRUG AB
- Page 160 and 161:
154 EPIDEMIOLOGIC TRENDS IN DRUG AB
- Page 162 and 163:
156 2003. Anecdotal information on
- Page 164 and 165:
Brownsville, and El Paso. African-A
- Page 166 and 167:
160 EPIDEMIOLOGIC TRENDS IN DRUG AB
- Page 168 and 169:
162 EPIDEMIOLOGIC TRENDS IN DRUG AB
- Page 170 and 171:
ground economy, it was estimated th
- Page 172 and 173:
According to street interviews, mos
- Page 174 and 175:
that crack sells for about $28,000-
- Page 176 and 177:
Benloton, X-man, 911, Lean Back, Se
- Page 178 and 179:
DAWN ME mentions for marijuana-invo
- Page 180 and 181:
ecstasy. MDMA ED mentions may be st
- Page 182 and 183:
176 EPIDEMIOLOGIC TRENDS IN DRUG AB
- Page 184 and 185:
178 EPIDEMIOLOGIC TRENDS IN DRUG AB
- Page 186 and 187:
180 EPIDEMIOLOGIC TRENDS IN DRUG AB
- Page 188 and 189:
EPIDEMIOLOGIC TRENDS IN DRUG ABUSE
- Page 190 and 191:
the deaths, while Whites constitute
- Page 192 and 193:
2000 reported that the average hero
- Page 194 and 195:
for this drug, making olanzapine th
- Page 196 and 197:
190 EPIDEMIOLOGIC TRENDS IN DRUG AB
- Page 198 and 199:
192 EPIDEMIOLOGIC TRENDS IN DRUG AB
- Page 200 and 201:
EPIDEMIOLOGIC TRENDS IN DRUG ABUSE
- Page 202 and 203:
ADHS/DBHS reported that more than o
- Page 204 and 205:
Marijuana is widely available in Ar
- Page 206 and 207:
EPIDEMIOLOGIC TRENDS IN DRUG ABUSE
- Page 208 and 209:
EPIDEMIOLOGIC TRENDS IN DRUG ABUSE
- Page 210 and 211:
EPIDEMIOLOGIC TRENDS IN DRUG ABUSE
- Page 212 and 213:
206 EPIDEMIOLOGIC TRENDS IN DRUG AB
- Page 214 and 215:
208 EPIDEMIOLOGIC TRENDS IN DRUG AB
- Page 216 and 217:
EPIDEMIOLOGIC TRENDS IN DRUG ABUSE
- Page 218 and 219:
212 2004. Data from 2000-2002 DAWN
- Page 220 and 221:
purity dropped to 14.4 percent in 2
- Page 222 and 223:
No recent GHB incidents or deaths w
- Page 224 and 225:
218 EPIDEMIOLOGIC TRENDS IN DRUG AB
- Page 226 and 227:
EPIDEMIOLOGIC TRENDS IN DRUG ABUSE
- Page 228 and 229:
correspond to decreases in total ad
- Page 230 and 231:
224 EPIDEMIOLOGIC TRENDS IN DRUG AB
- Page 232 and 233:
EPIDEMIOLOGIC TRENDS IN DRUG ABUSE
- Page 234 and 235:
228 reports in drug-related visits;
- Page 236 and 237:
Marijuana Arrests for marijuana-rel
- Page 238 and 239:
positivity. UHS staff believe, on t
- Page 240 and 241:
234 EPIDEMIOLOGIC TRENDS IN DRUG AB
- Page 242 and 243:
236 are not estimates for the repor
- Page 244 and 245:
were evident. Excluding missing dat
- Page 246 and 247:
The characteristics of other opiate
- Page 248 and 249:
June 2004 (exhibit 6c). A minority
- Page 250 and 251:
Deaths involving depressants were a
- Page 252 and 253:
imipramine) are an older class of m
- Page 254 and 255:
248 EPIDEMIOLOGIC TRENDS IN DRUG AB
- Page 256 and 257:
250 EPIDEMIOLOGIC TRENDS IN DRUG AB
- Page 258 and 259:
252 EPIDEMIOLOGIC TRENDS IN DRUG AB
- Page 260 and 261:
254 EPIDEMIOLOGIC TRENDS IN DRUG AB
- Page 262 and 263:
256 EPIDEMIOLOGIC TRENDS IN DRUG AB
- Page 264 and 265:
258 EPIDEMIOLOGIC TRENDS IN DRUG AB
- Page 266 and 267:
EPIDEMIOLOGIC TRENDS IN DRUG ABUSE
- Page 268 and 269:
The term “lag” refers to the pe
- Page 270 and 271:
costs $1,200-$1,500, compared with
- Page 272 and 273:
ties. In the DFW area, Mexican mari
- Page 274 and 275:
The 2004 secondary school survey re
- Page 276 and 277:
nio and two 2-ounce bottles cost $1
- Page 278 and 279:
age may be partially due to the fac
- Page 280 and 281:
EPIDEMIOLOGIC TRENDS IN DRUG ABUSE
- Page 282 and 283:
276 EPIDEMIOLOGIC TRENDS IN DRUG AB
- Page 284 and 285:
EPIDEMIOLOGIC TRENDS IN DRUG ABUSE
- Page 286 and 287:
280 EPIDEMIOLOGIC TRENDS IN DRUG AB
- Page 288 and 289:
282 EPIDEMIOLOGIC TRENDS IN DRUG AB
- Page 290 and 291:
EPIDEMIOLOGIC TRENDS IN DRUG ABUSE
- Page 292 and 293:
286 EPIDEMIOLOGIC TRENDS IN DRUG AB
- Page 294 and 295:
EPIDEMIOLOGIC TRENDS IN DRUG ABUSE
- Page 296 and 297:
York and Miami (Pach et al. 2002).
- Page 298 and 299:
In 2003, heroin was the primary sub
- Page 300 and 301:
opolitan Police Department report t
- Page 302 and 303:
296 EPIDEMIOLOGIC TRENDS IN DRUG AB
- Page 304 and 305:
298 EPIDEMIOLOGIC TRENDS IN DRUG AB
- Page 306 and 307:
EPIDEMIOLOGIC TRENDS IN DRUG ABUSE
- Page 309:
International Report
- Page 312 and 313:
Among GTC patients, marijuana was t
- Page 314 and 315:
Others (63.8 percent) were using a
- Page 316 and 317:
310 EPIDEMIOLOGIC TRENDS IN DRUG AB
- Page 318 and 319:
312 EPIDEMIOLOGIC TRENDS IN DRUG AB
- Page 320 and 321:
EPIDEMIOLOGIC TRENDS IN DRUG ABUSE
- Page 323:
Panel on Methamphetamine Abuse: NID
- Page 326 and 327:
EPIDEMIOLOGIC TRENDS IN DRUG ABUSE
- Page 328 and 329:
322 EPIDEMIOLOGIC TRENDS IN DRUG AB
- Page 330 and 331:
324 EPIDEMIOLOGIC TRENDS IN DRUG AB
- Page 333:
Appendix A New Drug Abuse Warning N
- Page 336 and 337:
DAWN LIVE! The new DAWN includes ca
- Page 339 and 340:
Participant List National Institute
- Page 341 and 342:
Janie B. Dargan, M.S.W. Policy Anal
- Page 343:
Martin P. Paulus, M.D. Associate Pr