- Page 1:
ChemOffice.Com ® ChemOffice ® Che
- Page 4 and 5:
License Information ChemOffice, Che
- Page 6 and 7:
· Licensed users of ChemOffice Ent
- Page 8 and 9:
computer, except as provided below.
- Page 10 and 11:
Q: IS IT OK TO COPY MY COLLEAGUE’
- Page 12 and 13:
A Guide to CambridgeSoft Manuals An
- Page 14 and 15:
Chapter 31: Changes and Audit Trail
- Page 16 and 17:
Administrator Tutorial 7: Docking M
- Page 18 and 19:
Administrator Connection Table . .
- Page 20 and 21:
Administrator Specifying Properties
- Page 22 and 23:
Administrator Undoing Changes . . .
- Page 24 and 25:
Administrator Chapter 28: Introduci
- Page 26 and 27:
Administrator Atom Properties . . .
- Page 28 and 29:
Administrator Deleting a Field Type
- Page 30 and 31:
Administrator Example 2. . . . . .
- Page 32 and 33:
Administrator Reaction Center . . .
- Page 34 and 35:
Administrator In addition to browsi
- Page 36 and 37:
Administrator Microsoft®Windows®
- Page 38 and 39:
Administrator Truncated-Newton-Raph
- Page 40 and 41:
Administrator the activation each t
- Page 42 and 43:
Administrator The following table d
- Page 44 and 45:
Administrator • Stereo Pairs—A
- Page 46 and 47:
Administrator • Bond Angles—Dis
- Page 48 and 49:
Administrator The Building Toolbar
- Page 50 and 51:
Administrator The Calculation Toolb
- Page 52 and 53:
Administrator 1. Right-click in the
- Page 54 and 55:
Administrator • In the Model Sett
- Page 56 and 57:
Administrator modes and color setti
- Page 58 and 59:
Administrator 26 •Chem3D Basics C
- Page 60 and 61:
Administrator 2. Click the ChemDraw
- Page 62 and 63:
3. Move the pointer over the C-C bo
- Page 64 and 65:
Administrator Add serial numbers an
- Page 66 and 67:
Administrator 5. Press the Enter ke
- Page 68 and 69:
. Administrator b. From the Structu
- Page 70 and 71:
Administrator In the Measurements t
- Page 72 and 73:
A molecule of Epinephrine appears.
- Page 74 and 75:
Administrator Tutorial 7: Docking M
- Page 76 and 77:
Administrator To save the iteration
- Page 78 and 79:
The allyl radical, CH 2 =CHCH 2·,
- Page 80 and 81:
Administrator Determine the raw spi
- Page 82 and 83:
Administrator atoms are relatively
- Page 84 and 85:
Administrator The following table d
- Page 86 and 87:
Administrator When Correct Atom Typ
- Page 88 and 89:
Administrator To use the same text
- Page 90 and 91:
Administrator Example 2. Building a
- Page 92 and 93:
Administrator copied into blank tab
- Page 94 and 95:
Administrator 3. Type the atom type
- Page 96 and 97:
Administrator Clean Up Structure or
- Page 98 and 99:
Setting Serial Numbers this step, y
- Page 100 and 101:
Administrator Refining a Model Afte
- Page 102 and 103:
Administrator Selecting Multiple At
- Page 104 and 105:
Administrator New in Chem3D version
- Page 106 and 107:
Administrator Dragging moves atoms
- Page 108 and 109:
Administrator 3. Hold down the Shif
- Page 110 and 111:
To position a plane in your model p
- Page 112 and 113:
Administrator • Second Positioned
- Page 114 and 115:
Administrator For example, consider
- Page 116 and 117:
To change the structural display ty
- Page 118 and 119:
Administrator When sizing by partia
- Page 120 and 121:
Administrator Depth Fading3D enhanc
- Page 122 and 123:
• Select Parallel to rotate the r
- Page 124 and 125:
Administrator • From the Computat
- Page 126 and 127:
Surface Type Description Surface Ty
- Page 128 and 129:
Administrator 2. Adjust the slider
- Page 130 and 131:
Administrator Density surface is ca
- Page 132 and 133:
Administrator 100•Displaying Mode
- Page 134 and 135:
Administrator If you want to displa
- Page 136 and 137:
Administrator Example: To examine t
- Page 138 and 139:
Administrator Chem3D provides two o
- Page 140 and 141:
Administrator change a property. By
- Page 142 and 143:
Administrator To add to a group: 1.
- Page 144 and 145:
To stop spinning: • On the Movie
- Page 146 and 147:
Administrator If you want to … Th
- Page 148 and 149:
Administrator EPS The PostScript fi
- Page 150 and 151:
If you want the file to … Then cl
- Page 152 and 153:
Molecular Design Limited MolFile (.
- Page 154 and 155:
Administrator 7. Leave the last lin
- Page 156 and 157:
Administrator 124•Printing and Ex
- Page 158 and 159:
Administrator • Semiempirical Ext
- Page 160 and 161:
Method Type Advantages Disadvantage
- Page 162 and 163:
Administrator • A single point ca
- Page 164 and 165:
Administrator • Molecular mechani
- Page 166 and 167:
Administrator constant), while θ 0
- Page 168 and 169:
Administrator The van der Waals int
- Page 170 and 171:
Administrator 6. The modified value
- Page 172 and 173:
the same wave function and a consta
- Page 174 and 175:
Administrator A variety of other ba
- Page 176 and 177:
Administrator Molecular wave functi
- Page 178 and 179:
Administrator activation barriers.
- Page 180 and 181:
3. From the Calculations menu, poin
- Page 182 and 183:
Administrator Intermediate status m
- Page 184 and 185:
Administrator staggered form. The m
- Page 186 and 187:
Administrator During dragging, the
- Page 188 and 189:
If you want to … Then Click … A
- Page 190 and 191:
Compute Properties The Compute Prop
- Page 192 and 193:
Administrator C(2)-C(3)-C(4) bond a
- Page 194 and 195:
Administrator The procedures assume
- Page 196 and 197:
Administrator improvements in each
- Page 198 and 199:
Administrator • Overall errors in
- Page 200 and 201:
Administrator The following table c
- Page 202 and 203:
Administrator TRIPLET QUARTET QUINT
- Page 204 and 205:
Administrator Chemical symbol ++ ba
- Page 206 and 207:
Administrator 4. Click Run. A new m
- Page 208 and 209:
Administrator Minimizing Energy Min
- Page 210 and 211:
Administrator criteria, to optimize
- Page 212 and 213:
Administrator 6. Hold down the S ke
- Page 214 and 215:
Administrator Dipole Moment The dip
- Page 216 and 217:
Administrator Molecular Surfaces Mo
- Page 218 and 219:
The following table contains the ke
- Page 220 and 221:
Administrator 3. Click in the model
- Page 222 and 223:
Keyword Description 7. On the Prope
- Page 224 and 225:
Administrator Hyperfine Coupling Co
- Page 226 and 227:
Administrator 194•MOPAC Computati
- Page 228 and 229:
Administrator If you want to … re
- Page 230 and 231:
Administrator In the Results In tex
- Page 232 and 233:
Administrator Repeating a Gaussian
- Page 234 and 235:
Administrator To specify the calcul
- Page 236 and 237:
Administrator 3. Click Open. The ap
- Page 238 and 239:
Property Description Property Descr
- Page 240 and 241:
Property Description Error Message
- Page 242 and 243:
Administrator Property Electronic E
- Page 244 and 245:
Administrator • Server—limits t
- Page 246 and 247:
Administrator To perform property c
- Page 248 and 249:
The Step 4 of 4 dialog box appears.
- Page 250 and 251:
Administrator • From the ChemOffi
- Page 252 and 253:
Administrator 220•Introduction Ca
- Page 254 and 255:
. The components of the ChemFinder
- Page 256 and 257:
Administrator Screen Element Table
- Page 258 and 259:
Administrator • From the View men
- Page 260 and 261:
Administrator A form displays data
- Page 262 and 263:
. In this tutorial, you learn to cr
- Page 264 and 265:
A selected data box is designated b
- Page 266 and 267:
Administrator The database opens, a
- Page 268 and 269:
9. Click the Form tab. There should
- Page 270 and 271:
to see some of the information avai
- Page 272 and 273:
• From the Record menu, choose Fi
- Page 274 and 275:
Administrator The Table view appear
- Page 276 and 277:
+ The ISICCR database opens in Chem
- Page 278 and 279:
Administrator To search over a list
- Page 280 and 281:
When you release the mouse button,
- Page 282 and 283:
Administrator 250•ChemFinder Tuto
- Page 284 and 285: The Open dialog box appears. To cho
- Page 286 and 287: A data source tree appears, contain
- Page 288 and 289: ChemFinder saves the form with a .c
- Page 290 and 291: The framed data box is labeled. NOT
- Page 292 and 293: Administrator To save a metafile fr
- Page 294 and 295: Administrator • Rich Text—displ
- Page 296 and 297: Administrator Adding a Data Box Men
- Page 298 and 299: Administrator Customizing Numbers U
- Page 300 and 301: Administrator When the selection to
- Page 302 and 303: To line up objects on a form: Admin
- Page 304 and 305: Administrator to those usernames. M
- Page 306 and 307: Administrator • Take the appropri
- Page 308 and 309: To disable security and reset defau
- Page 310 and 311: Administrator • In the new dialog
- Page 312 and 313: To search: Administrator 8. Take th
- Page 314 and 315: Administrator 282•Relational Data
- Page 316 and 317: Administrator The following table s
- Page 318 and 319: 1. Click one of the column headers
- Page 320 and 321: Administrator Creating Tables There
- Page 322 and 323: Creating Fields Administrator 4. Fr
- Page 324 and 325: The name of the new field appears i
- Page 326 and 327: Administrator ChemFinder creates a
- Page 328 and 329: Administrator atoms contained in th
- Page 330 and 331: Administrator • If you are editin
- Page 332 and 333: Administrator The record is permane
- Page 336 and 337: Administrator Context menu options
- Page 338 and 339: Administrator In the bottom diagram
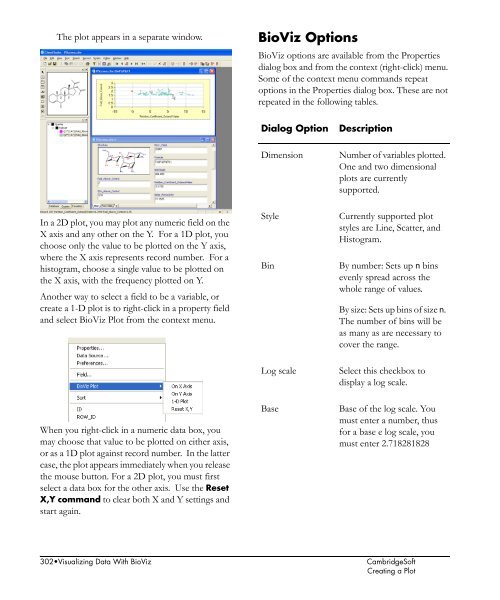
- Page 340 and 341: Administrator 308•Visualizing Dat
- Page 342 and 343: The general procedure for importing
- Page 344 and 345: Administrator Using Log Files Durin
- Page 346 and 347: Administrator d. The input file has
- Page 348 and 349: Administrator Export to SDFile When
- Page 350 and 351: Administrator benz OR *bromo* Benze
- Page 352 and 353: Search Type Administrator Normal Se
- Page 354 and 355: Administrator The hit list will inc
- Page 356 and 357: Administrator as part of the data a
- Page 358 and 359: Administrator • Setting the searc
- Page 360 and 361: If you want to Then click Administr
- Page 362 and 363: Administrator ChemFinder searches o
- Page 364 and 365: Administrator • With Stereo Cente
- Page 366 and 367: Administrator Managing Queries Chem
- Page 368 and 369: To reset searches to the full datab
- Page 370 and 371: Administrator To create the hitlist
- Page 372 and 373: Administrator Using ChemDraw's Atom
- Page 374 and 375: Administrator With reaction centers
- Page 376 and 377: To set the options for what ChemFin
- Page 378 and 379: Administrator To return all the too
- Page 380 and 381: Administrator Creating a Script To
- Page 382 and 383: Administrator rather difficult, but
- Page 384 and 385:
Administrator 352•Customizing Che
- Page 386 and 387:
Administrator Opening an Oracle Dat
- Page 388 and 389:
Administrator • Restore Previous
- Page 390 and 391:
Administrator 6. Set other options
- Page 392 and 393:
Administrator 360•ChemFinder/Orac
- Page 394 and 395:
To activate CombiChem/Excel: The Co
- Page 396 and 397:
Administrator Adding a Reaction Tem
- Page 398 and 399:
Administrator Reactant List Format
- Page 400 and 401:
Administrator • You can configure
- Page 402 and 403:
An analysis of the reaction steps a
- Page 404 and 405:
Administrator ChemFinder/Office tit
- Page 406 and 407:
Administrator For more information
- Page 408 and 409:
Administrator The Open Chemical Str
- Page 410 and 411:
Administrator 3. From the Molecules
- Page 412 and 413:
Administrator To use the Search Opt
- Page 414 and 415:
Changing the Chem- Finder/Office Pr
- Page 416 and 417:
Administrator • Enhanced table of
- Page 418 and 419:
Administrator In addition, this gui
- Page 420 and 421:
Administrator 388• Introducing E-
- Page 422 and 423:
Administrator You can organize coll
- Page 424 and 425:
Creating a Page or Experiment Admin
- Page 426 and 427:
Administrator Working with the User
- Page 428 and 429:
Administrator Showing and Hiding Co
- Page 430 and 431:
Administrator • Right-click any b
- Page 432 and 433:
Administrator If your system config
- Page 434 and 435:
Administrator Your system configura
- Page 436 and 437:
Administrator Working with Template
- Page 438 and 439:
Administrator Desired Result Change
- Page 440 and 441:
Administrator To export to MS Word:
- Page 442 and 443:
Administrator 410• E-Notebook Use
- Page 444 and 445:
Administrator NO 2 NO 2 Me Me HC(OE
- Page 446 and 447:
Administrator • Top of Arrow as R
- Page 448 and 449:
Administrator • Equivalents - the
- Page 450 and 451:
The example below shows the Prepara
- Page 452 and 453:
Administrator Ethanol was selected,
- Page 454 and 455:
Administrator Type in the AutoText
- Page 456 and 457:
Adding Properties to Property Lists
- Page 458 and 459:
Type of Measurement Permitted Units
- Page 460 and 461:
3. Enter the URL and click OK. Work
- Page 462 and 463:
Administrator A new Ancillary Data
- Page 464 and 465:
Administrator Replacing a Spectrum
- Page 466 and 467:
The row is removed from the Table.
- Page 468 and 469:
Administrator you enter an invalid
- Page 470 and 471:
Administrator Type of Measurement m
- Page 472 and 473:
Administrator 4. The spreadsheet ap
- Page 474 and 475:
5. Click the section menu icon. The
- Page 476 and 477:
Administrator Printing Sections You
- Page 478 and 479:
Administrator Clicking the Changes
- Page 480 and 481:
. Administrator The version of the
- Page 482 and 483:
Administrator In some configuration
- Page 484 and 485:
Administrator 452• Changes and Au
- Page 486 and 487:
Administrator 2. If no form appears
- Page 488 and 489:
Administrator Query Text Field The
- Page 490 and 491:
Administrator • In searching subs
- Page 492 and 493:
Administrator Isotopes Isotopic lab
- Page 494 and 495:
Finds: Cl Does not find: Finds: O D
- Page 496 and 497:
Administrator either side) is part
- Page 498 and 499:
Administrator • Browse to the roo
- Page 500 and 501:
Administrator 2. Select Remove Prop
- Page 502 and 503:
Administrator Advanced Text Searchi
- Page 504 and 505:
For example, the following searches
- Page 506 and 507:
Administrator Searching For ... Ret
- Page 508 and 509:
3. Click the Search In... checkbox
- Page 510 and 511:
Administrator The Collection Tree a
- Page 512 and 513:
2. Select Session Manager.... The S
- Page 514 and 515:
Administrator A new section type ap
- Page 516 and 517:
Administrator See the following top
- Page 518 and 519:
Administrator 3. If necessary, clic
- Page 520 and 521:
compute the checksum for the upload
- Page 522 and 523:
Administrator 4. A new Section List
- Page 524 and 525:
Administrator Managing the Audit Se
- Page 526 and 527:
Administrator The field appears in
- Page 528 and 529:
A menu appears. 2. Select Box Prope
- Page 530 and 531:
Showing the Name of a Box To show t
- Page 532 and 533:
Administrator contained box accordi
- Page 534 and 535:
Administrator In the form we are sh
- Page 536 and 537:
Administrator For example, if there
- Page 538 and 539:
Administrator 506• Managing Secti
- Page 540 and 541:
Administrator Several fields types
- Page 542 and 543:
Administrator • Default Font - yo
- Page 544 and 545:
The Section Type Configuration dial
- Page 546 and 547:
Administrator Example 1 In this exa
- Page 548 and 549:
Administrator See the following top
- Page 550 and 551:
Administrator Associating a list of
- Page 552 and 553:
Administrator • Username - An opt
- Page 554 and 555:
Administrator To add a property lis
- Page 556 and 557:
Administrator from the Property dro
- Page 558 and 559:
Administrator The Field Properties
- Page 560 and 561:
Administrator Another feature of ta
- Page 562 and 563:
Administrator 3. Right-click the Ta
- Page 564 and 565:
Administrator • SupplierID - the
- Page 566 and 567:
Administrator reactants and product
- Page 568 and 569:
Managing Search Fields Administrato
- Page 570 and 571:
Administrator • Certain types of
- Page 572 and 573:
4. Enter a name for the field and s
- Page 574 and 575:
Administrator To access the Add-In
- Page 576 and 577:
Administrator In the query table fi
- Page 578 and 579:
Administrator 546• Managing Field
- Page 580 and 581:
Creating a New Collection Type The
- Page 582 and 583:
Administrator 5. Click the Add>> bu
- Page 584 and 585:
Administrator A menu appears with t
- Page 586 and 587:
Administrator 2. To expand the coll
- Page 588 and 589:
Administrator Adding a Collection L
- Page 590 and 591:
Administrator A menu appears. 4. Se
- Page 592 and 593:
Administrator the Rename command in
- Page 594 and 595:
Administrator contained collection
- Page 596 and 597:
Administrator Creating a Search Typ
- Page 598 and 599:
Administrator Chemical Structure Se
- Page 600 and 601:
Administrator To add states to a co
- Page 602 and 603:
• Removing a Transition Listener
- Page 604 and 605:
Administrator • Unlocked Contents
- Page 606 and 607:
Administrator If the user wants to
- Page 608 and 609:
A new Transition Listener appears,
- Page 610 and 611:
Administrator To view the export te
- Page 612 and 613:
Administrator To edit this data, 1.
- Page 614 and 615:
Administrator Setting the Region fo
- Page 616 and 617:
Administrator 584• User Administr
- Page 618 and 619:
Administrator 2. If Inherits Securi
- Page 620 and 621:
To change the Transition Security P
- Page 622 and 623:
Administrator The Security tab appe
- Page 624 and 625:
Administrator To disable inherited
- Page 626 and 627:
Administrator Desired Result Remove
- Page 628 and 629:
Administrator 596• Managing E-Not
- Page 630 and 631:
Administrator Section Listeners E-N
- Page 632 and 633:
Administrator • Add Reactant tabl
- Page 634 and 635:
Administrator have an OK button onl
- Page 636 and 637:
Administrator 604 • CambridgeSoft
- Page 638 and 639:
Administrator Accessing the Online
- Page 640 and 641:
Administrator To find a structure t
- Page 642 and 643:
Administrator The CS ChemOffice SDK
- Page 644 and 645:
Administrator Troubleshooting This
- Page 646 and 647:
Administrator Defining Substructure
- Page 648 and 649:
Administrator If an atom can be ass
- Page 650 and 651:
Administrator Example 3 In Example
- Page 652 and 653:
Administrator 14 13 H 2.197 -0.8229
- Page 654 and 655:
Administrator Connection tables by
- Page 656 and 657:
Administrator FORTRAN Formats The F
- Page 658 and 659:
5 6 1.11606 3 109.41 5 109.41 -1 21
- Page 660 and 661:
Administrator 41 4 1 0 0 0 0 0 0 0
- Page 662 and 663:
Administrator 32 3 12 1 0 0 0 33 3
- Page 664 and 665:
Administrator 13 * 3D displacement
- Page 666 and 667:
Administrator The field value for C
- Page 668 and 669:
Administrator Line 4e: C 1.53597 1
- Page 670 and 671:
Administrator CONECT 4 2 9 10 11 CO
- Page 672 and 673:
Administrator COMPND ATOM HETATM CO
- Page 674 and 675:
Administrator Line 56 -2794 21139 6
- Page 676 and 677:
Administrator 7 2 10 1 8 3 6 1 9 3
- Page 678 and 679:
Administrator Line 16 6 C -0.559 1.
- Page 680 and 681:
Administrator 12. Line 30, “@BOND
- Page 682 and 683:
Parameter Table Use Parameter Table
- Page 684 and 685:
Administrator 3. Type the informati
- Page 686 and 687:
Administrator Geometry The geometry
- Page 688 and 689:
Administrator KS The KS, or bond st
- Page 690 and 691:
Administrator one attached hydrogen
- Page 692 and 693:
Administrator bond length between t
- Page 694 and 695:
Administrator R* The R* field is th
- Page 696 and 697:
Administrator The V1 torsional cons
- Page 698 and 699:
Administrator VDW Interactions The
- Page 700 and 701:
Key Drag Shift+Drag Administrator Q
- Page 702 and 703:
Administrator 670• Keyboard Modif
- Page 704 and 705:
Administrator Editing Parameters Yo
- Page 706 and 707:
Administrator 6. The pi molecular o
- Page 708 and 709:
Administrator Adding Parameters to
- Page 710 and 711:
Administrator Bond Type Wavy specif
- Page 712 and 713:
Administrator HO HO HO N H H N N H
- Page 714 and 715:
Administrator Atom lists may contai
- Page 716 and 717:
O O Bond Type Description Administr
- Page 718 and 719:
Administrator 686• Structural Que
- Page 720 and 721:
Formula Chemfinder Interpretation A
- Page 722 and 723:
Administrator For the two compounds
- Page 724 and 725:
Administrator You do not need to sp
- Page 726 and 727:
Administrator boxes it contains. Th
- Page 728 and 729:
Administrator GET retrieves a value
- Page 730 and 731:
Administrator You may concatenate v
- Page 732 and 733:
Administrator Script-Only Commands
- Page 734 and 735:
Administrator 702• CAL Commands C
- Page 736 and 737:
Administrator open a large table an
- Page 738 and 739:
Administrator 706• CS Oracle Cart
- Page 740 and 741:
Administrator Access (continued) re
- Page 742 and 743:
Administrator Atom-to-Atom mapping
- Page 744 and 745:
Administrator Changing (continued)
- Page 746 and 747:
Administrator Combi experiments 367
- Page 748 and 749:
Administrator Creating (continued)
- Page 750 and 751:
Administrator Dihedral type field 6
- Page 752 and 753:
Administrator Exporting (continued)
- Page 754 and 755:
Administrator Frame interval contro
- Page 756 and 757:
Administrator Importing (continued)
- Page 758 and 759:
Administrator Managing (continued)
- Page 760 and 761:
Administrator Mol_ID field 287 Mola
- Page 762 and 763:
Administrator Opening (continued) p
- Page 764 and 765:
Administrator Property query and ta
- Page 766 and 767:
Administrator Redo command 269, 299
- Page 768 and 769:
Administrator Search Details prefer
- Page 770 and 771:
Administrator Sextic bending consta
- Page 772 and 773:
Administrator Subforms (continued)
- Page 774 and 775:
Administrator User interface 9 User
- Page 776 and 777:
Administrator xxxviii• CambridgeS
- Page 778 and 779:
CAMBRIDGESOFT ChemOffice Desktop to
- Page 780 and 781:
CS ChemOffice Software Suites ChemO
- Page 782 and 783:
DESKTOP CS E-Notebook Electronic Jo
- Page 784 and 785:
DESKTOP CS ChemDraw Chemical Struct
- Page 786 and 787:
DESKTOP CS Chem3D Molecular Modelin
- Page 788 and 789:
DESKTOP CS ChemFinder Searching and
- Page 790 and 791:
DESKTOP CS ChemInfo Reference and C
- Page 792 and 793:
ENTERPRISE ChemOffice WebServer Ent
- Page 794 and 795:
ENTERPRISE Oracle Cartridge Enterpr
- Page 796 and 797:
KNOWLEDGE E-Notebook Enterprise Des
- Page 798 and 799:
KNOWLEDGE Document Manager Desktop
- Page 800 and 801:
KNOWLEDGE 21CFR11 Compliance Electr
- Page 802 and 803:
RESEARCH & Registration System Chem
- Page 804 and 805:
RESEARCH & Inventory Manager Chemic
- Page 806 and 807:
RESEARCH & CombiChem Enterprise Des
- Page 808 and 809:
RESEARCH & BioAssay HTS Biological
- Page 810 and 811:
RESEARCH & BioSAR Browser Biologica
- Page 812 and 813:
CHEMICAL ChemACX Database Available
- Page 814 and 815:
CHEMICAL The Merck Index Chemistry
- Page 816 and 817:
CHEMICAL Chemical Databases Referen
- Page 818 and 819:
CONSULTING & Consulting & Services
- Page 821:
CS Software Problem Report For fast