- Page 2 and 3:
LOUISIANA DEPARTMENT OF EDUCATION 1
- Page 7 and 8:
THE SCHOOL IMPROVEMENT PROCESS: •
- Page 9 and 10:
FEDERAL REGULATIONS FOR NO CHILD LE
- Page 11 and 12:
NCLB - SEC. 1116. ACADEMIC ASSESSME
- Page 13 and 14:
SCHOOL IMPROVEMENT PLAN CROSSWALK T
- Page 15 and 16:
Ten Components of a Schoolwide Prog
- Page 17 and 18:
Ten Components of a Schoolwide Prog
- Page 19 and 20:
LOUISIANA STATE LEGISLATURE STATUTE
- Page 21 and 22:
SCHOOL IMPROVEMENT PROCESS IN LOUIS
- Page 23 and 24:
THE CYCLE OF THE SCHOOL IMPROVEMENT
- Page 25 and 26:
ROLES AND RESPONSIBIILTIES IN THE P
- Page 27 and 28:
Role SIT (together with the DAT and
- Page 29:
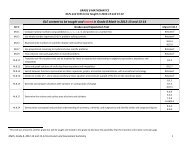
RECOMMENDED TIMELINE FOR MEETING TH
- Page 32 and 33:
GUIDING QUESTIONS 1. How do student
- Page 35 and 36:
GOALS A goal states the general edu
- Page 37 and 38:
SAMPLE GOAL(S) FORMAT (Select no mo
- Page 39 and 40:
OBJECTIVES An objective is an expre
- Page 41:
OBJECTIVES Resources Conzemius, A.
- Page 44 and 45:
• Goals • Objectives • Indica
- Page 46 and 47:
STEPS TO TAKE 1. Review Best Practi
- Page 48 and 49:
Louisiana Department of Education I
- Page 50:
Scientifically Based Research Strat
- Page 53 and 54:
5. Create detailed activities that
- Page 55 and 56:
Examples: • Model lessons provide
- Page 58 and 59:
PROFESSIONAL DEVELOPMENT The term
- Page 60 and 61:
ROLE OF LEADERSHIP IN SUPPORTING PR
- Page 62 and 63:
PROFESSIONAL DEVELOPMENT Resources
- Page 65 and 66:
FAMILY AND COMMUNITY INVOLVEMENT Fa
- Page 67 and 68:
FAMILY AND COMMUNITY INVOLVEMENT AC
- Page 69 and 70:
What is Needed: • Free documentat
- Page 72 and 73:
CURRICULUM What is taught (content)
- Page 74 and 75:
STEPS TO TAKE Monitoring the Taught
- Page 76 and 77:
CURRICULUM Resources The following
- Page 78 and 79:
Center for Applied Linguistics. htt
- Page 80 and 81:
Association of Teachers of French.
- Page 82 and 83:
Kilpatrick, Jeremy, Swafford, Jane,
- Page 84 and 85:
Social Studies American Presidents.
- Page 87 and 88:
COORDINATION OF RESOURCES DEFINITIO
- Page 89:
COORDINATION OF RESOURCES Resources
- Page 92 and 93:
Rubric: • Behavioral Data: The Cl
- Page 94 and 95:
OBJECTIVES Guideline I. Objectives
- Page 96 and 97:
Guideline II. The action plan lists
- Page 98 and 99:
Rubric: Acceptable III. Follow‐up
- Page 100 and 101:
Rubric: Acceptable Not Acceptable I
- Page 102:
Guideline II. The summative (long
- Page 105 and 106:
• Provide the DUNS number for eac
- Page 107 and 108:
After Site Visit: 1. The team membe
- Page 109 and 110:
5. Meaningful, Engaged Learning (ME
- Page 111 and 112:
SAMPLE PARISH SCHOOL SYSTEM DIG PRO
- Page 113 and 114:
SAMPLE PARISH SCHOOL SYSTEM DIG PRO
- Page 115 and 116:
Sample Site Visit Schedule: Apple H
- Page 117 and 118:
DIG CLASSROOM OBSERVATION FORM‐PA
- Page 119 and 120:
LOUISIANA NEEDS ANALYSIS (LANA) Cla
- Page 121 and 122:
DIG TEAM LEADER INSTRUCTIONS SITE V
- Page 123 and 124:
DIG TEAM LEADER INSTRUCTIONS SUMMAR
- Page 125 and 126:
Indicator 1c: _____________________
- Page 127 and 128:
DIG TEAM LEADER INSTRUCTIONS EXIT S
- Page 129 and 130:
B. Discuss the DIG Team’s overall
- Page 131 and 132:
B. Discuss the DIG Team’s overall
- Page 133 and 134:
SCHOOL ADMINISTRATOR(S) INTERVIEW (
- Page 135 and 136:
DIG TEAM LEADER INSTRUCTIONS TEACHE
- Page 137 and 138:
Teacher Questionnaire (Fourth Quart
- Page 139 and 140:
DIG TEAM LEADER INSTRUCTIONS END‐
- Page 141 and 142:
TEACHER QUESTIONNAIRE REPORT FORM I
- Page 143 and 144:
TEACHER QUESTIONNAIRE REPORT FORM (
- Page 146 and 147:
SAMPLE STRATEGIES Strategy 1 Univer
- Page 149 and 150:
Action Plan - Activities indicated
- Page 151 and 152:
USING THE DATA TO WRITE MEASURABLE
- Page 153 and 154:
Step 5: Identify weakest/strongest
- Page 156 and 157:
SAMPLING PARAMETERS Stakeholder Pop
- Page 158:
CLOSING THE ACHIEVEMENT GAP An achi
- Page 161 and 162:
Louisiana Department of Education I
- Page 163 and 164:
Standards for Identifying Effective
- Page 165 and 166:
Criterion 3: Reliable and Valid Dat
- Page 167 and 168:
• For the findings to be consider
- Page 169 and 170:
THE PROCESS OF SELECTING BEST PRACT
- Page 172 and 173:
SEC. 1118. PARENTAL INVOLVEMENT Tit
- Page 175 and 176:
Professional Development About Prof
- Page 177 and 178:
Professional Learning Strategies an
- Page 179 and 180:
Stage 2: Personal Concerns a. Legit
- Page 181 and 182:
Louisiana Rubric for Assessing Resu
- Page 183 and 184:
Resources Standard Level 4 No Appli
- Page 185 and 186:
Evaluation Standard Level 4 No Appl
- Page 187 and 188:
Design Standard Level 4 No Applicat
- Page 189 and 190:
Standard Level 4 No Application of
- Page 191 and 192:
Standard Level 4 No Application of
- Page 193 and 194:
EFFECTIVE PROFESSIONAL DEVELOPMENT
- Page 195 and 196:
Facilitating Professional Developme
- Page 197 and 198:
Strategies for Attracting High‐Qu
- Page 199 and 200:
Making It Happen Evaluation and ass
- Page 201:
This optional worksheet is designed
- Page 204 and 205:
Five Levels of Professional Develop
- Page 206 and 207: School Improvement Plan Implementat
- Page 208 and 209: Keeping the Plan “Alive” 1. Sch
- Page 210: If… Then Recommendation Your lead
- Page 213 and 214: COMPETITIVE FISCAL RESOURCES 4 5 Fu
- Page 215 and 216: COMPETITIVE FISCAL RESOURCES 8 Fund
- Page 217 and 218: ENTITLEMENT FISCAL RESOURCES 4 5 Fu
- Page 219 and 220: ENTITLEMENT FISCAL RESOURCES 8 9 Fu
- Page 221 and 222: ENTITLEMENT FISCAL RESOURCES Fundin
- Page 223 and 224: ENTITLEMENT FISCAL RESOURCES 15 16
- Page 225: FISCAL RESOURCES ALLOWABLE EXPENDIT
- Page 228 and 229: Overview The Data Analysis Template
- Page 230 and 231: Subgroups by Ethnicity Native/Alask
- Page 232 and 233: DEVELOPMENTAL READING ASSESSMENT SC
- Page 234 and 235: WHOLE SCHOOL SPS: CRT (iLEAP) Trend
- Page 236 and 237: WHOLE SCHOOL SPS: NRT Trend Data In
- Page 238 and 239: SUBGROUP: Percent Proficient Trend
- Page 240 and 241: SUBGROUP: Percent Proficient Trend
- Page 242 and 243: SUBGROUP: Percent Proficient Trend
- Page 244 and 245: SUBGROUP: Percent Proficient Trend
- Page 246 and 247: SUBGROUP: Percent Proficient Trend
- Page 248 and 249: SUBGROUP: Percent Proficient Trend
- Page 250 and 251: SUBGROUP: Percent Proficient Trend
- Page 252 and 253: SUBGROUP: Percent Proficient Trend
- Page 254 and 255: SUBGROUP: Percent Proficient Trend
- Page 258 and 259: Step 10: Identify any subject area
- Page 260 and 261: Step 4: Identify any subject area w
- Page 262 and 263: 4th Grade LEAP School Performance P
- Page 264 and 265: 8th Grade LEAP School Performance P
- Page 266 and 267: 10th Grade LEAP School Performance
- Page 268 and 269: 3rd Grade iLEAP School Performance
- Page 270 and 271: 5th Grade iLEAP School Performance
- Page 272 and 273: 6th Grade iLEAP School Performance
- Page 274 and 275: 7th Grade iLEAP School Performance
- Page 276 and 277: 9th Grade iLEAP School Performance
- Page 278 and 279: Math Content Standard Number and Nu
- Page 280 and 281: Across all subjects, identify 3 str
- Page 282 and 283: iLEAP Data Analysis Worksheet Grade
- Page 284 and 285: iLEAP Data Analysis Worksheet Grade
- Page 286 and 287: LOUISIANA NEEDS ANALYSIS (LANA) Con
- Page 288 and 289: LOUISIANA NEEDS ANALYSIS (LANA) Con
- Page 290 and 291: Faculty Needs Assessment STRENGTHS
- Page 292 and 293: LANA INSTRUMENT REPORTING FORM Pare
- Page 294 and 295: LANA INSTRUMENT REPORTING FORM Cont
- Page 296 and 297: School Improvement Plan Submission
- Page 298 and 299: School Improvement Plan SCHOOL IMPR
- Page 300 and 301: School Improvement Plan 6. Strategi
- Page 302 and 303: School Improvement Plan TABLE OF CO
- Page 304 and 305: School Improvement Plan Guideline I
- Page 306 and 307:
School Improvement Plan DATA PORTFO
- Page 308 and 309:
School Improvement Plan FEDERAL/STA
- Page 310 and 311:
School Improvement Plan Data Triang
- Page 312 and 313:
School Improvement Plan DATA COMPRE
- Page 314 and 315:
Action Plan - Activities indicated
- Page 316 and 317:
Action Plan - Activities indicated
- Page 318 and 319:
Louisiana Measure of Progress (LAMP