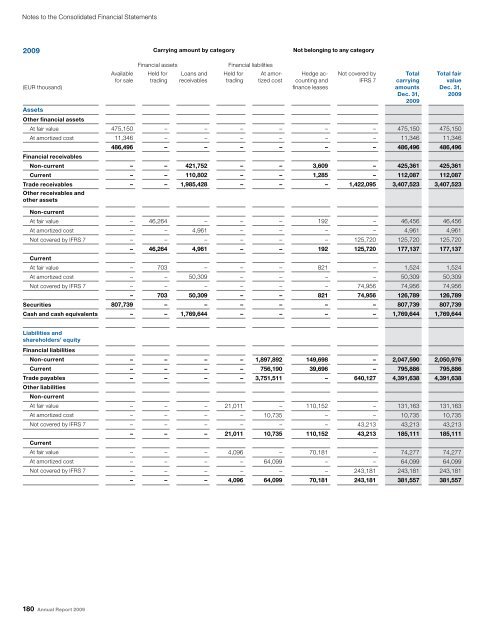
Notes to the Consolidated Financial Statements 2009 (EUR thousand) 180 Annual Report 2009 Available for sale Carrying amount by category Not belonging to any category Financial assets Financial liabilities Held for trading Loans and receivables Held for trading At amortized cost Hedge accounting and finance leases Not covered by IFRS 7 Total carrying amounts Dec. 31, 2009 Total fair value Dec. 31, 2009 Assets Other financial assets At fair value 475,150 – – – – – – 475,150 475,150 At amortized cost 11,346 – – – – – – 11,346 11,346 Financial receivables 486,496 – – – – – – 486,496 486,496 Non-current – – 421,752 – – 3,609 – 425,361 425,361 Current – – 110,802 – – 1,285 – 112,087 112,087 Trade receivables Other receivables and other assets – – 1,985,428 – – – 1,422,095 3,407,523 3,407,523 Non-current At fair value – 46,264 – – – 192 – 46,456 46,456 At amortized cost – – 4,961 – – – – 4,961 4,961 Not covered by IFRS 7 – – – – – – 125,720 125,720 125,720 Current – 46,264 4,961 – – 192 125,720 177,137 177,137 At fair value – 703 – – – 821 – 1,524 1,524 At amortized cost – – 50,309 – – – – 50,309 50,309 Not covered by IFRS 7 – – – – – – 74,956 74,956 74,956 – 703 50,309 – – 821 74,956 126,789 126,789 Securities 807,739 – – – – – – 807,739 807,739 Cash and cash equivalents – – 1,769,644 – – – – 1,769,644 1,769,644 Liabilities and shareholders’ equity Financial liabilities Non-current – – – – 1,897,892 149,698 – 2,047,590 2,050,976 Current – – – – 756,190 39,696 – 795,886 795,886 Trade payables Other liabilities Non-current – – – – 3,751,511 – 640,127 4,391,638 4,391,638 At fair value – – – 21,011 – 110,152 – 131,163 131,163 At amortized cost – – – – 10,735 – – 10,735 10,735 Not covered by IFRS 7 – – – – – – 43,213 43,213 43,213 Current – – – 21,011 10,735 110,152 43,213 185,111 185,111 At fair value – – – 4,096 – 70,181 – 74,277 74,277 At amortized cost – – – – 64,099 – – 64,099 64,099 Not covered by IFRS 7 – – – – – – 243,181 243,181 243,181 – – – 4,096 64,099 70,181 243,181 381,557 381,557
2008 (EUR thousand) Available for sale ❘ Information for our Shareholders ❘ ❘ Management Report ❘ ❘ Financial Statements and Notes ❘ Carrying amount by category Not belonging to any category Financial assets Financial liabilities Held for trading Loans and receivables Held for trading At amortized cost Hedge accounting and finance leases Not covered by IFRS 7 Total carrying amounts Dec. 31, 2008 Total fair value Dec. 31, 2008 Assets Other financial assets At fair value 406,785 – – – – – – 406,785 406,785 At amortized cost 23,273 – – – – – – 23,273 23,273 Financial receivables 430,058 – – – – – – 430,058 430,058 Non-current – – 347,982 – – 4,686 – 352,668 352,668 Current – – 91,944 – – 1,369 – 93,313 93,313 Trade receivables Other receivables and other assets – – 2,510,907 – – – 1,272,349 3,783,256 3,783,256 Non-current At fair value – 7,622 – – – 1 – 7,623 7,623 At amortized cost – – 5,403 – – – – 5,403 5,403 Not covered by IFRS 7 – – – – – – 82,780 82,780 82,780 Current – 7,622 5,403 – – 1 82,780 95,806 95,806 At fair value – 2,860 – – – 5,513 – 8,373 8,373 At amortized cost – – 97,061 – – – – 97,061 97,061 Not covered by IFRS 7 – – – – – – 65,527 65,527 65,527 – 2,860 97,061 – – 5,513 65,527 170,961 170,961 Securities 809,396 – – – – – – 809,396 809,396 Cash and cash equivalents – – 1,787,713 – – – – 1,787,713 1,787,713 Liabilities and shareholders’ equity Financial liabilities Non-current – – – – 1,664,509 13,955 – 1,678,464 1,656,713 Current – – – – 1,230,199 18,153 – 1,248,352 1,248,352 Trade payables Other liabilities Non-current – – – – 3,890,487 – 671,284 4,561,771 4,561,771 At fair value – – – 28,009 – 142,435 – 170,444 170,444 At amortized cost – – – – 458 – – 458 458 Not covered by IFRS 7 – – – – – – 48,118 48,118 48,118 Current – – – 28,009 458 142,435 48,118 219,020 219,020 At fair value – – – 4,334 – 13,032 – 17,366 17,366 At amortized cost – – – – 45,698 – – 45,698 45,698 Not covered by IFRS 7 – – – – – – 204,044 204,044 204,044 – – – 4,334 45,698 13,032 204,044 267,108 267,108 Annual Report 2009 181
- Page 1 and 2:
HOCHTIEF Annual Report 2009 ONEROOF
- Page 3 and 4:
Our Company at a Glance in 2009 HOC
- Page 5 and 6:
Turning Vision into Value HOCHTIEF
- Page 7 and 8:
❘ Information for our Shareholder
- Page 9 and 10:
us: For instance, Leighton was awar
- Page 11 and 12:
A major topic relating to the HOCHT
- Page 13 and 14:
esolutions regarding the Executive
- Page 15 and 16:
Executive Board Dr.-Ing. Herbert L
- Page 17 and 18:
One focus of corporate governance a
- Page 19 and 20:
Executive Board compensation also i
- Page 21 and 22:
Supervisory Board compensation tion
- Page 23 and 24:
Indexed performance of HOCHTIEF sto
- Page 25 and 26:
Regional distribution (as of Decemb
- Page 27 and 28:
with the goal of improving an airpo
- Page 29 and 30:
HOCHTIEF Concessions Division: Conc
- Page 31 and 32:
❘ Information for our Shareholder
- Page 33 and 34:
Our global presence HOCHTIEF worldw
- Page 35 and 36:
*For further information, please se
- Page 37 and 38:
The economic crisis will continue t
- Page 39 and 40:
and communications. The weak infras
- Page 41 and 42:
This sustained growth will be affec
- Page 43 and 44:
Internationally, new orders fell by
- Page 45 and 46:
Strategy • Successful corporate s
- Page 47 and 48:
we bring together our experts for t
- Page 49 and 50:
Our cross-divisional competence cen
- Page 51 and 52:
stones of this consulting service i
- Page 53 and 54:
meters of concrete and 142,000 squa
- Page 55 and 56:
Employees • Staff development too
- Page 57 and 58:
market in the USA. Turner currently
- Page 59 and 60:
In our global procurement network,
- Page 61 and 62:
HOCHTIEF Group performance The HOCH
- Page 63 and 64:
Value Added • Net value added con
- Page 65 and 66:
Financial Review • Strong year-on
- Page 67 and 68:
The EUR 15 million negative amount
- Page 69 and 70:
to the emerging challenges of the f
- Page 71 and 72:
Further loans are in place on a loc
- Page 73 and 74:
y Leighton. Other non-current liabi
- Page 75 and 76:
HOCHTIEF Aktiengesellschaft Stateme
- Page 77 and 78:
als. Section 23 (1) of the Articles
- Page 79 and 80:
of parties acting in concert, acqui
- Page 81 and 82:
provided on appointment and replace
- Page 83 and 84:
Segment Reporting Synergies boost s
- Page 85 and 86:
delphia. The project is worth appro
- Page 87 and 88:
jet parking areas. The project will
- Page 89 and 90:
Project highlights in Australia Ser
- Page 91 and 92:
The new contract is worth approxima
- Page 93 and 94:
Budapest Airport HOCHTIEF AirPort s
- Page 95 and 96:
The Elefsina-Patras-Tsakona toll ro
- Page 97 and 98:
HOCHTIEF Europe Division • Return
- Page 99 and 100:
essary work in the North Sea. With
- Page 101 and 102:
HOCHTIEF Real Estate Division • S
- Page 103 and 104:
Together with the Senator Group, th
- Page 105 and 106:
unified and optimized. The associat
- Page 107 and 108:
HOCHTIEF Services Division • Exis
- Page 109 and 110:
2009. HOCHTIEF Energy Management wi
- Page 111 and 112:
Risk Report • Group-wide early wa
- Page 113 and 114:
Execution Ausführungsaudit Audit E
- Page 115 and 116:
Fiscal year 2010 will be shored up
- Page 117 and 118:
HOCHTIEF works with first-rate cert
- Page 119 and 120:
❘ Information for our Shareholder
- Page 121 and 122:
Investing in sustained growth Our c
- Page 123 and 124:
which was established in 2008, is a
- Page 125 and 126:
❘ Information for our Shareholder
- Page 127 and 128:
Consolidated Statement of Earnings
- Page 129 and 130: Consolidated Balance Sheet (EUR tho
- Page 131 and 132: ❘ Information for our Shareholder
- Page 133 and 134: [Independent] Auditors’ Report We
- Page 135 and 136: As in the prior year, the Consolida
- Page 137 and 138: Property, plant and equipment is st
- Page 139 and 140: The POC method is used primarily in
- Page 141 and 142: value initially recognized in equit
- Page 143 and 144: The remaining new or amended standa
- Page 145 and 146: IFRIC 17 Distributions of Non-cash
- Page 147 and 148: 6. Other operating expenses (EUR th
- Page 149 and 150: 9. Income taxes 2009 2008 (EUR thou
- Page 151 and 152: Impairment losses of EUR 64,000 (20
- Page 153 and 154: Impairment losses of EUR 58,000 (20
- Page 155 and 156: Associates The following tables sho
- Page 157 and 158: 17. Other receivables and other ass
- Page 159 and 160: The figure of EUR 1,422,095,000 (20
- Page 161 and 162: As of December 31, 2009, HOCHTIEF A
- Page 163 and 164: Top Executive Retention Plan 2004 T
- Page 165 and 166: The quantities of SARs and stock aw
- Page 167 and 168: Investing plan assets to cover futu
- Page 169 and 170: The effects of a one percentage poi
- Page 171 and 172: Sundry other financial liabilities
- Page 173 and 174: Maximum payments as of December 31,
- Page 175 and 176: Management of interest rate risk HO
- Page 177 and 178: The following sensitivity analyses
- Page 179: The impairments in trade receivable
- Page 183 and 184: The EUR 9,600,000 gains are include
- Page 185 and 186: 35. Segment reporting Segmental rep
- Page 187 and 188: Profit/(loss) from operating activi
- Page 189 and 190: All non-cash income and expense and
- Page 191 and 192: The fees for services provided in G
- Page 193 and 194: Corporate Headquarters ❘ Informat
- Page 195 and 196: Supervisory Board Committees Nomina
- Page 197 and 198: Glossary Alumni program The alumni
- Page 199 and 200: Our five year summary Five Year Sum
- Page 201 and 202: Publication Details and Credits Pub