ONE ROOF
ONE ROOF
ONE ROOF

You also want an ePaper? Increase the reach of your titles
YUMPU automatically turns print PDFs into web optimized ePapers that Google loves.
Our five year summary<br />
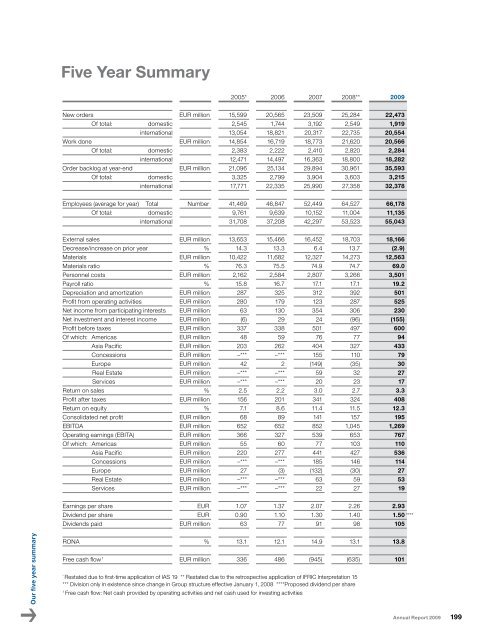
Five Year Summary<br />
2005* 2006 2007 2008** 2009<br />
New orders EUR million 15,599 20,565 23,509 25,284 22,473<br />
O f t o t a l : d o m e s t i c 2,545 1,744 3,192 2,549 1,919<br />
international 13,054 18,821 20,317 22,735 20,554<br />
Work done EUR million 14,854 16,719 18,773 21,620 20,566<br />
O f t o t a l : d o m e s t i c 2,383 2,222 2,410 2,820 2,284<br />
international 12,471 14,497 16,363 18,800 18,282<br />
Order backlog at year-end EUR million 21,096 25,134 29,894 30,961 35,593<br />
O f t o t a l : d o m e s t i c 3,325 2,799 3,904 3,603 3,215<br />
international 17,771 22,335 25,990 27,358 32,378<br />
Employees (average for year) Total Number 41,469 46,847 52,449 64,527 66,178<br />
O f t o t a l : d o m e s t i c 9,761 9,639 10,152 11,004 11,135<br />
international 31,708 37,208 42,297 53,523 55,043<br />
External sales EUR million 13,653 15,466 16,452 18,703 18,166<br />
Decrease/increase on prior year % 14.3 13.3 6.4 13.7 (2.9)<br />
Materials EUR million 10,422 11,682 12,327 14,273 12,563<br />
Materials ratio % 76.3 75.5 74.9 74.7 69.0<br />
Personnel costs EUR million 2,162 2,584 2,807 3,266 3,501<br />
Payroll ratio % 15.8 16.7 17.1 17.1 19.2<br />
Depreciation and amortization EUR million 287 325 312 392 501<br />
Profit from operating activities EUR million 280 179 123 287 525<br />
Net income from participating interests EUR million 63 130 354 306 230<br />
Net investment and interest income EUR million (6) 29 24 (96) (155)<br />
Profit before taxes EUR million 337 338 501 497 600<br />
Of which: Americas EUR million 48 59 76 77 94<br />
Asia Pacific EUR million 203 262 404 327 433<br />
Concessions EUR million –*** –*** 155 110 79<br />
Europe EUR million 42 2 (149) (35) 30<br />
Real Estate EUR million –*** –*** 59 32 27<br />
Services EUR million –*** –*** 20 23 17<br />
Return on sales % 2.5 2.2 3.0 2.7 3.3<br />
Profit after taxes EUR million 156 201 341 324 408<br />
Return on equity % 7.1 8.6 11.4 11.5 12.3<br />
Consolidated net profit EUR million 68 89 141 157 195<br />
EBITDA EUR million 652 652 852 1,045 1,269<br />
Operating earnings (EBITA) EUR million 366 327 539 653 767<br />
Of which: Americas EUR million 55 60 77 103 110<br />
Asia Pacific EUR million 220 277 441 427 536<br />
Concessions EUR million –*** –*** 185 146 114<br />
Europe EUR million 27 (3) (132) (30) 27<br />
Real Estate EUR million –*** –*** 63 59 53<br />
Services EUR million –*** –*** 22 27 19<br />
Earnings per share EUR 1.07 1.37 2.07 2.26 2.93<br />
Dividend per share EUR 0.90 1.10 1.30 1.40 1.50 ****<br />
Dividends paid EUR million 63 77 91 98 105<br />
RONA % 13.1 12.1 14.9 13.1 13.8<br />
Free cash flow 1 EUR million 336 486 (945) (635) 101<br />
* Restated due to first-time application of IAS 19 ** Restated due to the retrospective application of IFRIC Interpretation 15<br />
*** Division only in existence since change in Group structure effective January 1, 2008 ****Proposed dividend per share<br />
1 Free cash flow: Net cash provided by operating activities and net cash used for investing activities<br />
Annual Report 2009 199