ONE ROOF
ONE ROOF
ONE ROOF

You also want an ePaper? Increase the reach of your titles
YUMPU automatically turns print PDFs into web optimized ePapers that Google loves.
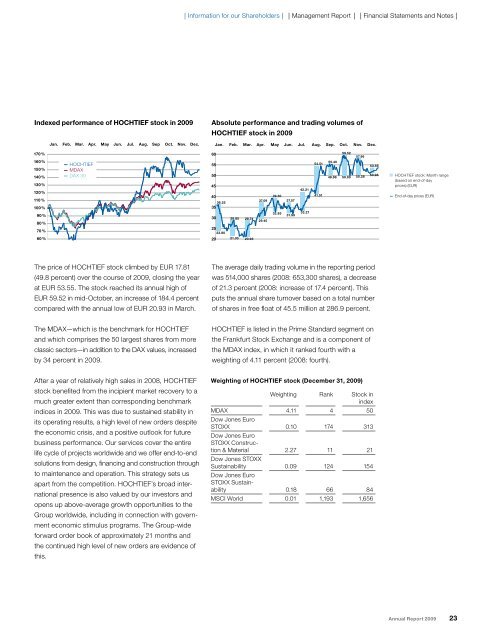
Indexed performance of HOCHTIEF stock in 2009<br />
The price of HOCHTIEF stock climbed by EUR 17.81<br />
(49.8 percent) over the course of 2009, closing the year<br />
at EUR 53.55. The stock reached its annual high of<br />
EUR 59.52 in mid-October, an increase of 184.4 percent<br />
compared with the annual low of EUR 20.93 in March.<br />
The MDAX—which is the benchmark for HOCHTIEF<br />
and which comprises the 50 largest shares from more<br />
classic sectors—in addition to the DAX values, increased<br />
by 34 percent in 2009.<br />
After a year of relatively high sales in 2008, HOCHTIEF<br />
stock benefited from the incipient market recovery to a<br />
much greater extent than corresponding benchmark<br />
indices in 2009. This was due to sustained stability in<br />
its operating results, a high level of new orders despite<br />
the economic crisis, and a positive outlook for future<br />
business performance. Our services cover the entire<br />
life cycle of projects worldwide and we offer end-to-end<br />
solutions from design, financing and construction through<br />
to maintenance and operation. This strategy sets us<br />
apart from the competition. HOCHTIEF’s broad international<br />
presence is also valued by our investors and<br />
opens up above-average growth opportunities to the<br />
Group worldwide, including in connection with government<br />
economic stimulus programs. The Group-wide<br />
forward order book of approximately 21 months and<br />
the continued high level of new orders are evidence of<br />
this.<br />
❘ Information for our Shareholders ❘ ❘ Management Report ❘ ❘ Financial Statements and Notes ❘<br />
Absolute performance and trading volumes of<br />
HOCHTIEF stock in 2009<br />
Jan. Feb. Mar. Apr. May Jun. Jul. Aug. Sep Oct. Nov. Dec. Jan. Feb. Mar. Apr. May Jun. Jul. Aug. Sep. Oct. Nov. Dec.<br />
170<br />
%<br />
60<br />
60<br />
59.52<br />
57.96<br />
160<br />
%<br />
150<br />
%<br />
— HOCHTIEF<br />
— MDAX<br />
55 55<br />
54.51<br />
55.40<br />
53.55<br />
140<br />
% — DAX 30<br />
50 50<br />
49.98 50.00 50.28<br />
50.98<br />
130<br />
%<br />
45 45<br />
120<br />
%<br />
110<br />
%<br />
40 40<br />
36.25<br />
37.09<br />
39.30<br />
37.07<br />
42.21<br />
41.51<br />
100<br />
%<br />
35 35<br />
090 90%<br />
080 80%<br />
30 30 28.85 28.74<br />
29.45<br />
32.83<br />
31.99<br />
33.27<br />
070 70%<br />
25 25<br />
23.80<br />
060 60%<br />
20 20 21.33 20.93<br />
The average daily trading volume in the reporting period<br />
was 514,000 shares (2008: 653,300 shares), a decrease<br />
of 21.3 percent (2008: increase of 17.4 percent). This<br />
puts the annual share turnover based on a total number<br />
of shares in free float of 45.5 million at 286.9 percent.<br />
HOCHTIEF is listed in the Prime Standard segment on<br />
the Frankfurt Stock Exchange and is a component of<br />
the MDAX index, in which it ranked fourth with a<br />
weighting of 4.11 percent (2008: fourth).<br />
Weighting of HOCHTIEF stock (December 31, 2009)<br />
Weighting Rank Stock in<br />
index<br />
MDAX 4.11 4 50<br />
Dow Jones Euro<br />
STOXX<br />
Dow Jones Euro<br />
STOXX Construc-<br />
0.10 174 313<br />
tion & Material<br />
Dow Jones STOXX<br />
2.27 11 21<br />
Sustainability<br />
Dow Jones Euro<br />
STOXX Sustain-<br />
0.09 124 154<br />
ability 0.18 66 84<br />
MSCI World 0.01 1,193 1,656<br />
� HOCHTIEF stock: Month range<br />
(based on end-of-day<br />
prices) (EUR)<br />
— End-of-day prices (EUR)<br />
Annual Report 2009 23