ONE ROOF
ONE ROOF
ONE ROOF

You also want an ePaper? Increase the reach of your titles
YUMPU automatically turns print PDFs into web optimized ePapers that Google loves.
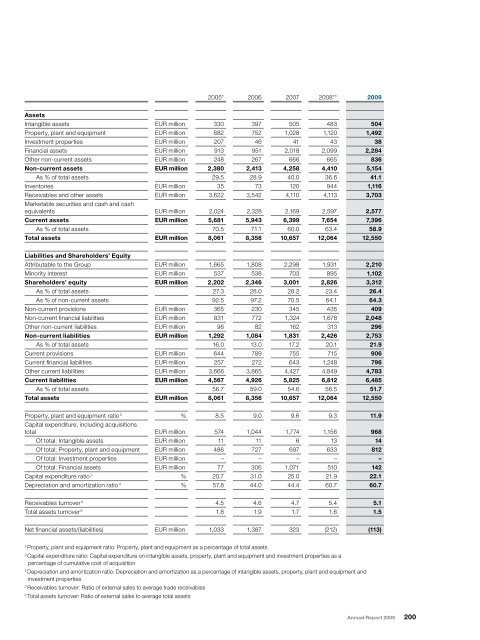
2005* 2006 2007 2008** 2009<br />
Assets<br />
Intangible assets EUR million 330 397 505 483 504<br />
Property, plant and equipment EUR million 682 752 1,028 1,120 1,492<br />
Investment properties EUR million 207 46 41 43 38<br />
Financial assets EUR million 913 951 2,018 2,099 2,284<br />
Other non-current assets EUR million 248 267 666 665 836<br />
Non-current assets EUR million 2,380 2,413 4,258 4,410 5,154<br />
As % of total assets 29.5 28.9 40.0 36.6 41.1<br />
Inventories EUR million 35 73 120 944 1,116<br />
Receivables and other assets<br />
Marketable securities and cash and cash<br />
EUR million 3,622 3,542 4,110 4,113 3,703<br />
equivalents EUR million 2,024 2,328 2,169 2,597 2,577<br />
Current assets EUR million 5,681 5,943 6,399 7,654 7,396<br />
As % of total assets 70.5 71.1 60.0 63.4 58.9<br />
Total assets EUR million 8,061 8,356 10,657 12,064 12,550<br />
Liabilities and Shareholders’ Equity<br />
Attributable to the Group EUR million 1,665 1,808 2,298 1,931 2,210<br />
Minority interest EUR million 537 538 703 895 1,102<br />
Shareholders’ equity EUR million 2,202 2,346 3,001 2,826 3,312<br />
As % of total assets 27.3 28.0 28.2 23.4 26.4<br />
As % of non-current assets 92.5 97.2 70.5 64.1 64.3<br />
Non-current provisions EUR million 365 230 345 435 409<br />
Non-current financial liabilities EUR million 831 772 1,324 1,678 2,048<br />
Other non-current liabilities EUR million 96 82 162 313 296<br />
Non-current liabilities EUR million 1,292 1,084 1,831 2,426 2,753<br />
As % of total assets 16.0 13.0 17.2 20.1 21.9<br />
Current provisions EUR million 644 789 755 715 906<br />
Current financial liabilities EUR million 257 272 643 1,248 796<br />
Other current liabilities EUR million 3,666 3,865 4,427 4,849 4,783<br />
Current liabilities EUR million 4,567 4,926 5,825 6,812 6,485<br />
As % of total assets 56.7 59.0 54.6 56.5 51.7<br />
Total assets EUR million 8,061 8,356 10,657 12,064 12,550<br />
Property, plant and equipment ratio 2 Capital expenditure, including acquisitions<br />
% 8.5 9.0 9.6 9.3 11.9<br />
total EUR million 574 1,044 1,774 1,156 968<br />
Of total: Intangible assets EUR million 11 11 6 13 14<br />
Of total: Property, plant and equipment EUR million 486 727 697 633 812<br />
Of total: Investment properties EUR million – – – – –<br />
Of total: Financial assets EUR million 77 306 1,071 510 142<br />
Capital expenditure ratio 3 % 20.7 31.0 25.0 21.9 22.1<br />
Depreciation and amortization ratio 4 % 57.8 44.0 44.4 60.7 60.7<br />
Receivables turnover 5 4.5 4.6 4.7 5.4 5.1<br />
Total assets turnover 6 1.8 1.9 1.7 1.6 1.5<br />
Net financial assets/(liabilities) EUR million 1,033 1,387 323 (212) (113)<br />
2 Property, plant and equipment ratio: Property, plant and equipment as a percentage of total assets<br />
3 Capital expenditure ratio: Capital expenditure on intangible assets, property, plant and equipment and investment properties as a<br />
percentage of cumulative cost of acquisition<br />
4 Depreciation and amortization ratio: Depreciation and amortization as a percentage of intangible assets, property, plant and equipment and<br />
investment properties<br />
5 Receivables turnover: Ratio of external sales to average trade receivables<br />
6 Total assets turnover: Ratio of external sales to average total assets<br />
Annual Report 2009 200