to download the complete report - GulfBase.com
to download the complete report - GulfBase.com
to download the complete report - GulfBase.com
Create successful ePaper yourself
Turn your PDF publications into a flip-book with our unique Google optimized e-Paper software.
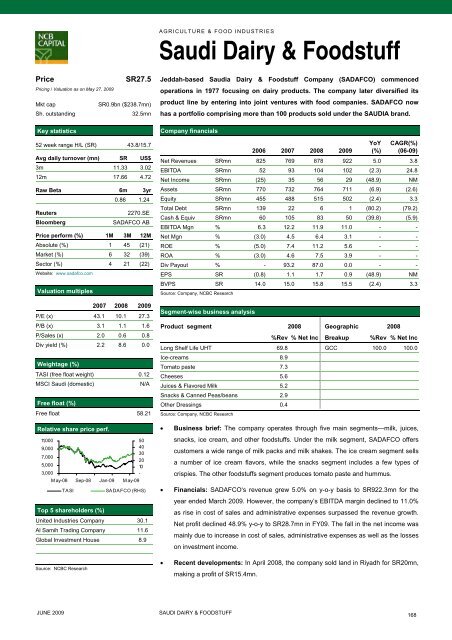
AGRICULTURE & FOOD INDUSTRIESSaudi Dairy & FoodstuffPricePricing / Valuation as on May 27, 2009Mkt capSh. outstandingKey statisticsSR27.5SR0.9bn ($238.7mn)32.5mn52 week range H/L (SR) 43.8/15.7Avg daily turnover (mn) SR US$3m 11.33 3.0212m 17.66 4.72Raw Beta 6m 3yr0.86 1.24ReutersBloomberg2270.SESADAFCO ABPrice perform (%) 1M 3M 12MAbsolute (%) 1 45 (21)Market (%) 6 32 (39)Sec<strong>to</strong>r (%) 4 21 (22)Website: www.sadafco.<strong>com</strong>Valuation multiples2007 2008 2009P/E (x) 43.1 10.1 27.3P/B (x) 3.1 1.1 1.6P/Sales (x) 2.0 0.6 0.8Div yield (%) 2.2 8.6 0.0Weightage (%)TASI (free float weight) 0.12MSCI Saudi (domestic)N/AFree float (%)Free float 58.21Relative share price perf.11,0009,0007,0005,0003,000M ay-08 Sep-08 Jan-09 M ay-09TASITop 5 shareholders (%)5040302010-SADAFCO (RHS)United Industries Company 30.1Al Samih Trading Company 11.6Global Investment House 8.9Source: NCBC ResearchJeddah-based Saudia Dairy & Foodstuff Company (SADAFCO) <strong>com</strong>mencedoperations in 1977 focusing on dairy products. The <strong>com</strong>pany later diversified itsproduct line by entering in<strong>to</strong> joint ventures with food <strong>com</strong>panies. SADAFCO nowhas a portfolio <strong>com</strong>prising more than 100 products sold under <strong>the</strong> SAUDIA brand.Company financials2006 2007 2008 2009YoY(%)CAGR(%)(06-09)Net Revenues SRmn 825 769 878 922 5.0 3.8EBITDA SRmn 52 93 104 102 (2.3) 24.8Net In<strong>com</strong>e SRmn (25) 35 56 29 (48.9) NMAssets SRmn 770 732 764 711 (6.9) (2.6)Equity SRmn 455 488 515 502 (2.4) 3.3Total Debt SRmn 139 22 6 1 (80.2) (79.2)Cash & Equiv SRmn 60 105 83 50 (39.8) (5.9)EBITDA Mgn % 6.3 12.2 11.9 11.0 - -Net Mgn % (3.0) 4.5 6.4 3.1 - -ROE % (5.0) 7.4 11.2 5.6 - -ROA % (3.0) 4.6 7.5 3.9 - -Div Payout % - 93.2 87.0 0.0 - -EPS SR (0.8) 1.1 1.7 0.9 (48.9) NMBVPS SR 14.0 15.0 15.8 15.5 (2.4) 3.3Source: Company, NCBC ResearchSegment-wise business analysisProduct segment 2008 Geographic 2008%Rev % Net Inc Breakup %Rev % Net IncLong Shelf Life UHT 69.8 GCC 100.0 100.0Ice-creams 8.9Toma<strong>to</strong> paste 7.3Cheeses 5.6Juices & Flavored Milk 5.2Snacks & Canned Peas/beans 2.9O<strong>the</strong>r Dressings 0.4Source: Company, NCBC Research• Business brief: The <strong>com</strong>pany operates through five main segments—milk, juices,snacks, ice cream, and o<strong>the</strong>r foodstuffs. Under <strong>the</strong> milk segment, SADAFCO offerscus<strong>to</strong>mers a wide range of milk packs and milk shakes. The ice cream segment sellsa number of ice cream flavors, while <strong>the</strong> snacks segment includes a few types ofcrispies. The o<strong>the</strong>r foodstuffs segment produces <strong>to</strong>ma<strong>to</strong> paste and hummus.• Financials: SADAFCO‘s revenue grew 5.0% on y-o-y basis <strong>to</strong> SR922.3mn for <strong>the</strong>year ended March 2009. However, <strong>the</strong> <strong>com</strong>pany’s EBITDA margin declined <strong>to</strong> 11.0%as rise in cost of sales and administrative expenses surpassed <strong>the</strong> revenue growth.Net profit declined 48.9% y-o-y <strong>to</strong> SR28.7mn in FY09. The fall in <strong>the</strong> net in<strong>com</strong>e wasmainly due <strong>to</strong> increase in cost of sales, administrative expenses as well as <strong>the</strong> losseson investment in<strong>com</strong>e.• Recent developments: In April 2008, <strong>the</strong> <strong>com</strong>pany sold land in Riyadh for SR20mn,making a profit of SR15.4mn.JUNE 2009SAUDI DAIRY & FOODSTUFF168


