to download the complete report - GulfBase.com
to download the complete report - GulfBase.com
to download the complete report - GulfBase.com

You also want an ePaper? Increase the reach of your titles
YUMPU automatically turns print PDFs into web optimized ePapers that Google loves.
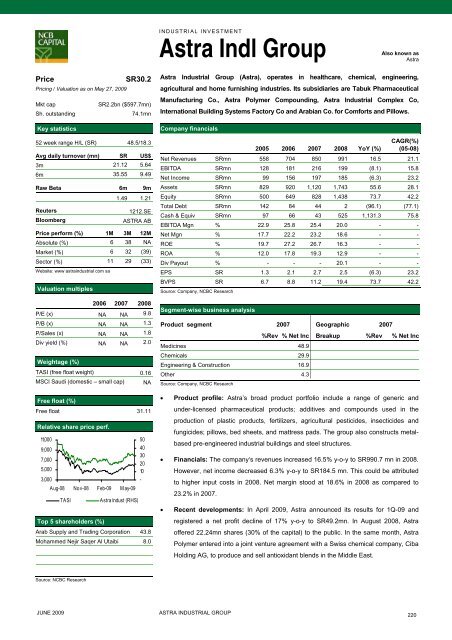
INDUSTRIAL INVESTMENTAstra Indl GroupAlso known asAstraPricePricing / Valuation as on May 27, 2009Mkt capSh. outstandingKey statisticsSR30.2SR2.2bn ($597.7mn)74.1mn52 week range H/L (SR) 48.5/18.3Avg daily turnover (mn) SR US$3m 21.12 5.646m 35.55 9.49Raw Beta 6m 9m1.49 1.21ReutersBloomberg1212.SEASTRA ABPrice perform (%) 1M 3M 12MAbsolute (%) 6 38 NAMarket (%) 6 32 (39)Sec<strong>to</strong>r (%) 11 29 (33)Website: www astraindustrial <strong>com</strong> saValuation multiples2006 2007 2008P/E (x) NA NA 9.8P/B (x) NA NA 1.3P/Sales (x) NA NA 1.8Div yield (%) NA NA 2.0Weightage (%)TASI (free float weight) 0.16MSCI Saudi (domestic – small cap) NAFree float (%)Free float 31.11Relative share price perf.11,0009,0007,0005,0003,000Aug-08 Nov-08 Feb-09 M ay-09TASITop 5 shareholders (%)Astra Indust (RHS)5040302010-Arab Supply and Trading Corporation 43.8Mohammed Nejir Saqer Al Utaibi 8.0Astra Industrial Group (Astra), operates in healthcare, chemical, engineering,agricultural and home furnishing industries. Its subsidiaries are Tabuk PharmaceuticalManufacturing Co., Astra Polymer Compounding, Astra Industrial Complex Co,International Building Systems Fac<strong>to</strong>ry Co and Arabian Co. for Comforts and Pillows.Company financials2005 2006 2007 2008 YoY (%)CAGR(%)(05-08)Net Revenues SRmn 558 704 850 991 16.5 21.1EBITDA SRmn 128 181 216 199 (8.1) 15.8Net In<strong>com</strong>e SRmn 99 156 197 185 (6.3) 23.2Assets SRmn 829 920 1,120 1,743 55.6 28.1Equity SRmn 500 649 828 1,438 73.7 42.2Total Debt SRmn 142 84 44 2 (96.1) (77.1)Cash & Equiv SRmn 97 66 43 525 1,131.3 75.8EBITDA Mgn % 22.9 25.8 25.4 20.0 - -Net Mgn % 17.7 22.2 23.2 18.6 - -ROE % 19.7 27.2 26.7 16.3 - -ROA % 12.0 17.8 19.3 12.9 - -Div Payout % - - - 20.1 - -EPS SR 1.3 2.1 2.7 2.5 (6.3) 23.2BVPS SR 6.7 8.8 11.2 19.4 73.7 42.2Source: Company, NCBC ResearchSegment-wise business analysisProduct segment 2007 Geographic 2007%Rev % Net Inc Breakup %Rev % Net IncMedicines 48.9Chemicals 29.9Engineering & Construction 16.9O<strong>the</strong>r 4.3Source: Company, NCBC Research• Product profile: Astra’s broad product portfolio include a range of generic andunder-licensed pharmaceutical products; additives and <strong>com</strong>pounds used in <strong>the</strong>production of plastic products, fertilizers, agricultural pesticides, insecticides andfungicides; pillows, bed sheets, and mattress pads. The group also constructs metalbasedpre-engineered industrial buildings and steel structures.• Financials: The <strong>com</strong>pany‘s revenues increased 16.5% y-o-y <strong>to</strong> SR990.7 mn in 2008.However, net in<strong>com</strong>e decreased 6.3% y-o-y <strong>to</strong> SR184.5 mn. This could be attributed<strong>to</strong> higher input costs in 2008. Net margin s<strong>to</strong>od at 18.6% in 2008 as <strong>com</strong>pared <strong>to</strong>23.2% in 2007.• Recent developments: In April 2009, Astra announced its results for 1Q-09 andregistered a net profit decline of 17% y-o-y <strong>to</strong> SR49.2mn. In August 2008, Astraoffered 22.24mn shares (30% of <strong>the</strong> capital) <strong>to</strong> <strong>the</strong> public. In <strong>the</strong> same month, AstraPolymer entered in<strong>to</strong> a joint venture agreement with a Swiss chemical <strong>com</strong>pany, CibaHolding AG, <strong>to</strong> produce and sell antioxidant blends in <strong>the</strong> Middle East.Source: NCBC ResearchJUNE 2009ASTRA INDUSTRIAL GROUP220