- Page 1 and 2:
NCB Capital Research DepartmentJune
- Page 3 and 4:
KSA ECONOMY AND NATION 5Outlook and
- Page 5 and 6:
KSA: Economy and NationSearching gr
- Page 7 and 8:
OUTLOOK AND DIRECTIONat a CAGR of 5
- Page 9 and 10:
OUTLOOK AND DIRECTIONpropel growth
- Page 11 and 12: OUTLOOK AND DIRECTIONThe dramatic c
- Page 13 and 14: OUTLOOK AND DIRECTIONExhibit 7: Sov
- Page 15 and 16: OUTLOOK AND DIRECTIONStrong hydroca
- Page 17: OUTLOOK AND DIRECTIONExhibit 13: KS
- Page 20 and 21: OUTLOOK AND DIRECTIONappropriate po
- Page 22 and 23: OUTLOOK AND DIRECTIONInternational
- Page 24 and 25: THIS PAGE IS INTENTIONALLY LEFT BLA
- Page 26 and 27: History and overviewThe leading GCC
- Page 28 and 29: HISTORY AND OVERVIEWExhibit 25: Bre
- Page 30 and 31: HISTORY AND OVERVIEWExhibit 29: Con
- Page 32 and 33: HISTORY AND OVERVIEWMarket regulati
- Page 34 and 35: HISTORY AND OVERVIEWeconomic condit
- Page 36 and 37: HISTORY AND OVERVIEWExhibit 38: Vol
- Page 38 and 39: THIS PAGE IS INTENTIONALLY LEFT BLA
- Page 40 and 41: Banking and FinancialsLeveraging th
- Page 42 and 43: BANKING AND FINANCIALSExhibit 43: R
- Page 44 and 45: BANKING AND FINANCIALSExhibit 50: A
- Page 46 and 47: PetrochemicalsCost advantage fuelli
- Page 48 and 49: PETROCHEMICALSExhibit 55: Compariso
- Page 50 and 51: CEMENTExhibit 60: Sector details% w
- Page 52 and 53: RetailBetting on increasing consume
- Page 54 and 55: RETAILExhibit 69: Revenue of compan
- Page 56 and 57: Energy and UtilitiesPrivatizing is
- Page 58 and 59: ENERGY AND UTILITIES(PIF) and SECO.
- Page 60 and 61: ENERGY AND UTILITIESincrease the ut
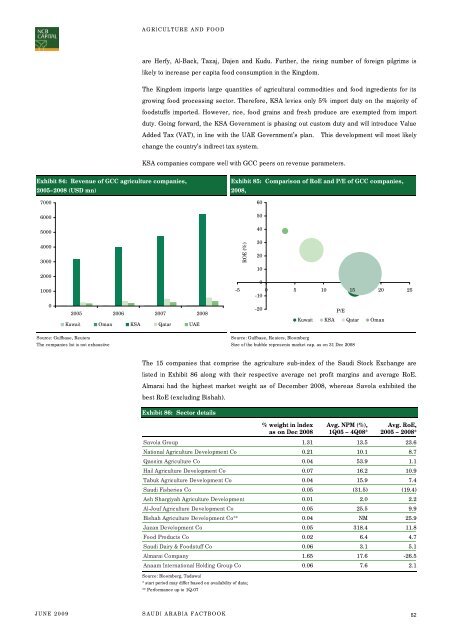
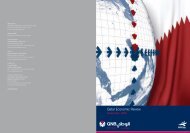
- Page 64 and 65: AGRICULTURE AND FOODExhibit 91: Ave
- Page 66 and 67: TELECOM AND ITline penetration stan
- Page 68 and 69: TELECOM AND ITZain started trading
- Page 70 and 71: INSURANCEExhibit 103: Country wise
- Page 72 and 73: INSURANCE(YoY), despite growth in r
- Page 74 and 75: Multi-investmentLight at the end of
- Page 76 and 77: MULTI-INVESTMENTExhibit 114: Revenu
- Page 78 and 79: Industrial InvestmentFacing the imp
- Page 80 and 81: INDUSTRIAL INVESTMENTExhibit 122: R
- Page 82 and 83: Building and ConstructionHealthy pi
- Page 84 and 85: BUILDING AND CONTRUCTIONThe buildin
- Page 86 and 87: BUILDING AND CONTRUCTIONSaudi Aramc
- Page 88 and 89: REAL ESTATE AND DEVELOPMENTExhibit
- Page 90 and 91: REAL ESTATE AND DEVELOPMENTsection
- Page 92 and 93: REAL ESTATE AND DEVELOPMENTExhibit
- Page 94 and 95: TRANSPORTATIONRoad transportRoad tr
- Page 96 and 97: TRANSPORTATIONNational Shipping Com
- Page 98 and 99: TRANSPORTATIONfears, and plunging f
- Page 100 and 101: MEDIA AND PUBLISHINGExhibit 159: Re
- Page 102 and 103: MEDIA AND PUBLISHINGExhibit 166: Av
- Page 104 and 105: HOTEL AND TOURISMSeparately, leisur
- Page 106 and 107: HOTEL AND TOURISMIn 2008, the secto
- Page 108 and 109: THIS PAGE IS INTENTIONALLY LEFT BLA
- Page 110 and 111: THIS PAGE IS INTENTIONALLY LEFT BLA
- Page 112 and 113:
BANKS AND FINANCIAL SERVICESAl Rajh
- Page 114 and 115:
BANKS AND FINANCIAL SERVICESBanque
- Page 116 and 117:
BANKS AND FINANCIAL SERVICESAlinma
- Page 118 and 119:
BANKS AND FINANCIAL SERVICESSABBAls
- Page 120 and 121:
BANKS AND FINANCIAL SERVICESBank Al
- Page 122 and 123:
BANKS AND FINANCIAL SERVICESBank Al
- Page 124 and 125:
PETROCHEMICAL INDUSTRIESSaudi Basic
- Page 126 and 127:
PETROCHEMICAL INDUSTRIESSaudi Kayan
- Page 128 and 129:
PETROCHEMICAL INDUSTRIESSaudi Indus
- Page 130 and 131:
PETROCHEMICAL INDUSTRIESRabigh Refi
- Page 132 and 133:
PETROCHEMICAL INDUSTRIESYanbu Natio
- Page 134 and 135:
PETROCHEMICAL INDUSTRIESNama Chemic
- Page 136 and 137:
PETROCHEMICAL INDUSTRIESMethanol Ch
- Page 138 and 139:
CEMENTSaudi CementAlso known asSCCP
- Page 140 and 141:
CEMENTSouthern CementAlso known asS
- Page 142 and 143:
CEMENTYanbu CementAlso known asYCCP
- Page 144 and 145:
PriceSR46.5Pricing / Valuation as o
- Page 146 and 147:
THIS PAGE IS INTENTIONALLY LEFT BLA
- Page 148 and 149:
RETAILJarir Marketing CoAlso known
- Page 150 and 151:
RETAILAldrees PetroleumAlso known a
- Page 152 and 153:
RETAILAhmed H. Fitaihi CoAlsoknown
- Page 154 and 155:
RETAILNational AgricultureAlsoknown
- Page 156 and 157:
THIS PAGE IS INTENTIONALLY LEFT BLA
- Page 158 and 159:
ENERGY AND UTILITIESSaudi ElectricA
- Page 160 and 161:
THIS PAGE IS INTENTIONALLY LEFT BLA
- Page 162 and 163:
AGRICULTURE & FOOD INDUSTRIESSavola
- Page 164 and 165:
AGRICULTURE & FOOD INDUSTRIESNation
- Page 166 and 167:
AGRICULTURE & FOOD INDUSTRIESQassim
- Page 168 and 169:
AGRICULTURE & FOOD INDUSTRIESSaudi
- Page 170 and 171:
AGRICULTURE & FOOD INDUSTRIESFood P
- Page 172 and 173:
AGRICULTURE & FOOD INDUSTRIESHalwan
- Page 174 and 175:
AGRICULTURE & FOOD INDUSTRIESTabuk
- Page 176 and 177:
THIS PAGE IS INTENTIONALLY LEFT BLA
- Page 178 and 179:
TELECOMMUNICATIONSaudi TelecomAlso
- Page 180 and 181:
TELECOMMUNICATIONZain KSAAlso known
- Page 182 and 183:
THIS PAGE IS INTENTIONALLY LEFT BLA
- Page 184 and 185:
INSURANCETawuniyaAlso known asTawun
- Page 186 and 187:
INSURANCESABB TakafulAlso known asS
- Page 188 and 189:
INSURANCEAl Sagr CompanyAlso Known
- Page 190 and 191:
INSURANCEBupa Arabia for Coop InsPr
- Page 192 and 193:
INSURANCESaudi IAIC Co-op.Also know
- Page 194 and 195:
INSURANCESanad InsuranceAlso known
- Page 196 and 197:
INSURANCESaudi Fransi Coop.Also kno
- Page 198 and 199:
PriceSR28.4Pricing / Valuation as o
- Page 200 and 201:
INSURANCESaudi Indian Co.Also known
- Page 202 and 203:
INSURANCESaudi Arabian Co-opAlsokno
- Page 204 and 205:
INSURANCEAllied Co-operativeAlso kn
- Page 206 and 207:
MULTI-INVESTMENTKingdom Holding CoA
- Page 208 and 209:
PriceSR57.5Pricing / Valuation as o
- Page 210 and 211:
PriceSR13.6Pricing / Valuation as o
- Page 212 and 213:
MULTI-INVESTMENTAl-Baha InvestmentA
- Page 214 and 215:
INDUSTRIAL INVESTMENTAlsoSaudi Arab
- Page 216 and 217:
INDUSTRIAL INVESTMENTSaudi Pharma.A
- Page 218 and 219:
INDUSTRIAL INVESTMENTSaudi Paper Mn
- Page 220 and 221:
INDUSTRIAL INVESTMENTAstra Indl Gro
- Page 222 and 223:
INDUSTRIAL INVESTMENTAlsoSaudi Indl
- Page 224 and 225:
INDUSTRIAL INVESTMENTAlso known asF
- Page 226 and 227:
BUILDING & CONSTRUCTIONSA Amiantit
- Page 228 and 229:
BUILDING & CONSTRUCTIONAl-Babtain P
- Page 230 and 231:
BUILDING & CONSTRUCTIONSaudi Cerami
- Page 232 and 233:
BUILDING & CONSTRUCTIONArabian Pipe
- Page 234 and 235:
BUILDING & CONSTRUCTIONME Specializ
- Page 236 and 237:
BUILDING & CONSTRUCTIONSaudi Indust
- Page 238 and 239:
THIS PAGE IS INTENTIONALLY LEFT BLA
- Page 240 and 241:
REAL ESTATE DEVELOPMENTDar Al Arkan
- Page 242 and 243:
REAL ESTATE DEVELOPMENTMakkah Const
- Page 244 and 245:
REAL ESTATE DEVELOPMENTTaiba Holdin
- Page 246 and 247:
REAL ESTATE DEVELOPMENTSaudi Real E
- Page 248 and 249:
TRANSPORTNational ShippingAlso know
- Page 250 and 251:
TRANSPORTUnited InternationalAlso k
- Page 252 and 253:
THIS PAGE IS INTENTIONALLY LEFT BLA
- Page 254 and 255:
MEDIA AND PUBLISHINGSaudi ResearchA
- Page 256 and 257:
MEDIA AND PUBLISHINGTihamaAlso know
- Page 258 and 259:
PricePricing / Valuation as on May
- Page 260:
Kindly send all mailing list reques