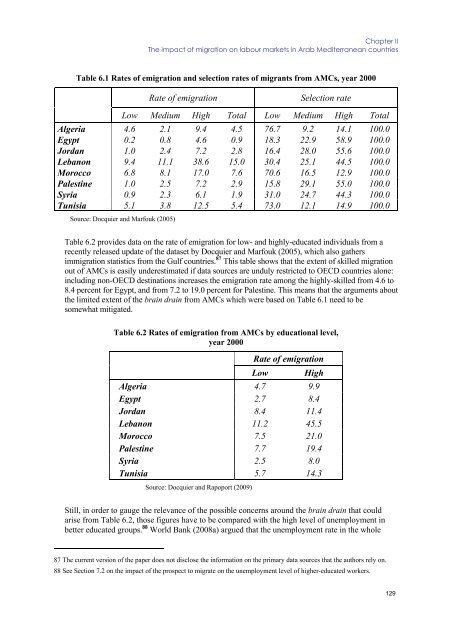
<strong>European</strong> CommissionOccasional Paper 60, Volume IJordan gives a telling case study in the labour <strong>market</strong> impact of <strong>migration</strong> <strong>flows</strong>, as – according toChatelard (2004) – Jordanian economic development is closely intertwined with the prevailingdynamics of international labour mobility. This was particularly true in the 1980s, when anestimated 42 percent of the labour force was expatriated, <strong>and</strong> such a massive outflow led to asubstantial decline in unemployment. When, in the early 1990s, a large number of Jordanians wererepatriated because of the Gulf War, the country experienced a 10 percent increase in itspopulation, causing heavy pressure on infrastructure, public services <strong>and</strong> housing, <strong>and</strong> theunemployment rate climbed as high as 30 percent (De Bel Air, 2008).By the same token, international <strong>migration</strong> has always been an essential route of escape for excesslabour supply among Palestinians: restrictions on entry to the Israeli labour <strong>market</strong> after thebeginning of the second Intifada created a sharp rise in unemployment, which increased from 13 to29 percent between 1999 <strong>and</strong> 2006 (Hilal, 2007).As far as the large countries of the Arab Mediterranean area are concerned, Ramamurthy (2003)finds that Egypt is the only one in his sample where e<strong>migration</strong> has had a significant effect onemployment. Nassar (2005) argues that – notwithst<strong>and</strong>ing data limitations <strong>and</strong> despite the fact thatthe best workers, <strong>and</strong> not the unemployed, are those who migrate – the direct impact of <strong>migration</strong>on the Egyptian labour <strong>market</strong> can be gauged from events during the Gulf crisis, when Iraq <strong>and</strong>Kuwait closed their borders, <strong>and</strong> many Egyptians were repatriated. 84The effects of <strong>migration</strong> on labour <strong>market</strong>s need not be confined to the areas of origin of themigrants, as international <strong>migration</strong> is strictly linked to the internal movement of peoples: it ofteninduces the internal relocation of labour forces. For instance, de Haas (2007) shows how migrantsending areas in Morocco became destinations for many internal migrants from other villages orfrom poorer regions; Berriane (1996) <strong>and</strong> El Meskine (1993), quoted in de Haas (2007), observesthat many construction <strong>and</strong> agricultural workers in the Rif area come from the Tafilalt <strong>and</strong> Draavalley in Southern Morocco.The figures about the aggregate size of <strong>migration</strong> – both in terms of <strong>flows</strong> <strong>and</strong> stocks – out ofAMCs needs to be h<strong>and</strong>led with caution as the most widely-used datasets – such as Docquier <strong>and</strong>Marfouk (2005) – are based on im<strong>migration</strong> statistics that do not cover the Gulf countries, asrecalled in Section 5. With this caveat in mind, Table 6.1 reveals that past <strong>and</strong> current <strong>migration</strong>patterns have an uneven impact on the main educational groups, as better-educated migrants areoverrepresented in the migrant population. While the emigrant population of these eight countriesis characterized by a varying skill profile, 85 as the data columns on selection rates show, the rate ofe<strong>migration</strong> from each of these countries is increasing in skill level. Lebanon, Morocco 86 <strong>and</strong> – to alesser extent – Tunisia are characterized by a rate of e<strong>migration</strong> among tertiary-educatedindividuals which might raise some concerns concerning a sizeable brain drain, that could push upthe skill premium in the labour–earnings distribution (see also section 1.2 on this). Indeed, Adams(2003) argues that Morocco <strong>and</strong> Tunisia suffer from a drain of their talented workers, though it isfair to say that the drain of skilled workers does not rank high among the factors that hinder theeconomic development in the AMCs countries – particularly in the larger Maghreb countries – as itis limited in size when compared to other developing regions, such as Sub-Saharan Africa (Ozden,2006).84 Similarly, Nassar (2008) argues that there have been clear benefits from e<strong>migration</strong> in terms of unemployment reductionin the 1980s, when Gulf countries attracted a large part of the Egyptian excess labour supply.85 The disproportionately high share of low-skilled individuals in the migrant population of the Maghreb countries – Algeria,Morocco <strong>and</strong> Tunisia – can be traced back to the existance of well-established <strong>migration</strong> networks with the countries ofdestination, which, as the recent paper by Beine et al. (2008a) shows, are associated with a reduction in the selection rate ofthe migrant population.86 In Morocco – together with Egypt <strong>and</strong> Jordan – the rate of return to education remains low (World Bank, 2008),notwithstaning the reported <strong>migration</strong> rate of tertiary-educated workers which could have pushed up skilled wages.128
Chapter IIThe impact of <strong>migration</strong> on labour <strong>market</strong>s in Arab Mediterranean countriesTable 6.1 Rates of e<strong>migration</strong> <strong>and</strong> selection rates of migrants from AMCs, year 2000Rate of e<strong>migration</strong>Selection rateLow Medium High Total Low Medium High TotalAlgeria 4.6 2.1 9.4 4.5 76.7 9.2 14.1 100.0Egypt 0.2 0.8 4.6 0.9 18.3 22.9 58.9 100.0Jordan 1.0 2.4 7.2 2.8 16.4 28.0 55.6 100.0Lebanon 9.4 11.1 38.6 15.0 30.4 25.1 44.5 100.0Morocco 6.8 8.1 17.0 7.6 70.6 16.5 12.9 100.0Palestine 1.0 2.5 7.2 2.9 15.8 29.1 55.0 100.0Syria 0.9 2.3 6.1 1.9 31.0 24.7 44.3 100.0Tunisia 5.1 3.8 12.5 5.4 73.0 12.1 14.9 100.0Source: Docquier <strong>and</strong> Marfouk (2005)Table 6.2 provides data on the rate of e<strong>migration</strong> for low- <strong>and</strong> highly-educated individuals from arecently released update of the dataset by Docquier <strong>and</strong> Marfouk (2005), which also gathersim<strong>migration</strong> statistics from the Gulf countries. 87 This table shows that the extent of skilled <strong>migration</strong>out of AMCs is easily underestimated if data sources are unduly restricted to OECD countries alone:including non-OECD destinations increases the e<strong>migration</strong> rate among the highly-skilled from 4.6 to8.4 percent for Egypt, <strong>and</strong> from 7.2 to 19.0 percent for Palestine. This means that the arguments aboutthe limited extent of the brain drain from AMCs which were based on Table 6.1 need to besomewhat mitigated.Table 6.2 Rates of e<strong>migration</strong> from AMCs by educational level,year 2000Rate of e<strong>migration</strong>LowHighAlgeria 4.7 9.9Egypt 2.7 8.4Jordan 8.4 11.4Lebanon 11.2 45.5Morocco 7.5 21.0Palestine 7.7 19.4Syria 2.5 8.0Tunisia 5.7 14.3Source: Docquier <strong>and</strong> Rapoport (2009)Still, in order to gauge the relevance of the possible concerns around the brain drain that couldarise from Table 6.2, those figures have to be compared with the high level of unemployment inbetter educated groups. 88 World Bank (2008a) argued that the unemployment rate in the whole87 The current version of the paper does not disclose the information on the primary data sources that the authors rely on.88 See Section 7.2 on the impact of the prospect to migrate on the unemployment level of higher-educated workers.129
- Page 5 and 6:
STUDYLABOUR MARKETS PERFORMANCE AND
- Page 7 and 8:
Table of ContentsLABOUR MARKETS PER
- Page 10:
8.1 Actual migration and consumptio
- Page 15 and 16:
Chapter IFinal Report 15 MILLION NE
- Page 17 and 18:
Chapter IFinal Report …so that MI
- Page 19 and 20:
Chapter IFinal Reportroots). The cu
- Page 21 and 22:
Chapter IFinal Report In AMCs, REMI
- Page 23 and 24:
Chapter IFinal Reportpolicies. This
- Page 25 and 26:
Chapter IFinal ReportMediterranean
- Page 27 and 28:
Chapter IFinal ReportMore recently,
- Page 29 and 30:
Chapter IFinal Reportfor EU employm
- Page 31 and 32:
Chapter IFinal Reportchosen, these
- Page 33 and 34:
Chapter IFinal Reportexit of women
- Page 35 and 36:
Chapter IFinal ReportFigure 1.2.1.
- Page 37 and 38:
Chapter IFinal ReportA Declining Em
- Page 39 and 40:
Chapter IFinal ReportThe same year,
- Page 41 and 42:
Chapter IFinal ReportTable 2.2.1. I
- Page 43 and 44:
Chapter IFinal Reportminimum wages
- Page 45 and 46:
Chapter IFinal Report2.4 Unemployme
- Page 47 and 48:
Chapter IFinal ReportYouth Unemploy
- Page 49 and 50:
Chapter IFinal ReportBut one should
- Page 51 and 52:
Chapter IFinal Reportmillion) 10 .
- Page 53 and 54:
Chapter IFinal Reportmight intensif
- Page 55 and 56:
Chapter IFinal Reporttrue labour ma
- Page 57 and 58:
Chapter IFinal Reportto reform the
- Page 59 and 60:
Chapter IFinal ReportFrom a differe
- Page 61 and 62:
Chapter IFinal ReportTable 4.2.1 Ou
- Page 63 and 64:
Chapter IFinal ReportSource: Adams
- Page 65 and 66:
Chapter IFinal Reportin the destina
- Page 67 and 68:
Chapter IFinal ReportIn conclusion,
- Page 69 and 70:
Chapter IFinal Reportorganised in B
- Page 71 and 72:
Chapter IFinal Reportsecond Intifad
- Page 73 and 74:
Chapter IFinal Reportstands at 29.7
- Page 75 and 76:
Chapter IFinal Reportconstruction w
- Page 77 and 78:
Chapter IFinal ReportAs far as the
- Page 79 and 80: Chapter IFinal Reportother cases, l
- Page 81 and 82: Chapter IFinal Reportunemployment a
- Page 83 and 84: Chapter IFinal Reportof Egypt, so f
- Page 85 and 86: Chapter IFinal ReportWhile progress
- Page 87 and 88: Chapter IFinal ReportThese reservat
- Page 89 and 90: Chapter IFinal ReportAs Figure 6.3.
- Page 91 and 92: Chapter IFinal Reportin skill devel
- Page 93 and 94: Chapter IFinal ReportThe Directive
- Page 95 and 96: Chapter IFinal ReportThe need for
- Page 97 and 98: Chapter IFinal Reportobjectives are
- Page 99 and 100: Chapter IFinal Reporttrue Euro-Medi
- Page 101 and 102: Chapter IFinal Report- Putting empl
- Page 103 and 104: Chapter IFinal Report promotion of
- Page 105 and 106: Chapter IFinal ReportOtherADAMS, R.
- Page 107 and 108: Chapter IFinal ReportDE BEL-AIR, F.
- Page 109 and 110: Chapter IFinal ReportGUPTA, S., C.
- Page 111 and 112: Chapter IFinal ReportOECD (2000): M
- Page 113 and 114: Chapter II - Thematic Background Pa
- Page 115 and 116: Chapter IIThe impact of migration o
- Page 117 and 118: Chapter IIThe impact of migration o
- Page 119 and 120: Chapter IIThe impact of migration o
- Page 121 and 122: Chapter IIThe impact of migration o
- Page 123 and 124: Chapter IIThe impact of migration o
- Page 125 and 126: Chapter IIThe impact of migration o
- Page 127 and 128: Chapter IIThe impact of migration o
- Page 129: Chapter IIThe impact of migration o
- Page 133 and 134: Chapter IIThe impact of migration o
- Page 135 and 136: Chapter IIThe impact of migration o
- Page 137 and 138: Chapter IIThe impact of migration o
- Page 139 and 140: Chapter IIThe impact of migration o
- Page 141 and 142: Chapter IIThe impact of migration o
- Page 143 and 144: Chapter IIThe impact of migration o
- Page 145 and 146: Chapter IIThe impact of migration o
- Page 147 and 148: Chapter IIThe impact of migration o
- Page 149 and 150: Chapter IIThe impact of migration o
- Page 151 and 152: Chapter IIThe impact of migration o
- Page 153 and 154: Chapter IIThe impact of migration o
- Page 155 and 156: Chapter IIThe impact of migration o
- Page 157 and 158: Chapter IIThe impact of migration o
- Page 159 and 160: Chapter IIThe impact of migration o
- Page 161 and 162: Chapter III - Thematic Background P
- Page 163 and 164: Chapter IIIEU Migration Policy towa
- Page 165 and 166: Chapter IIIEU Migration Policy towa
- Page 167 and 168: Chapter IIIEU Migration Policy towa
- Page 169 and 170: Chapter IIIEU Migration Policy towa
- Page 171 and 172: Chapter IIIEU Migration Policy towa
- Page 173 and 174: Chapter IIIEU Migration Policy towa
- Page 175 and 176: Chapter IIIEU Migration Policy towa
- Page 177 and 178: Chapter IIIEU Migration Policy towa
- Page 179 and 180: Chapter IIIEU Migration Policy towa
- Page 181 and 182:
Chapter IIIEU Migration Policy towa
- Page 183 and 184:
Chapter IIIEU Migration Policy towa
- Page 185 and 186:
Chapter IIIEU Migration Policy towa
- Page 187 and 188:
Chapter IIIEU Migration Policy towa
- Page 189 and 190:
Chapter IIIEU Migration Policy towa
- Page 191 and 192:
Chapter IIIEU Migration Policy towa
- Page 193 and 194:
Chapter IIIEU Migration Policy towa
- Page 195 and 196:
Chapter IIIEU Migration Policy towa
- Page 197 and 198:
Chapter IIIEU Migration Policy towa
- Page 199 and 200:
Chapter IIIEU Migration Policy towa
- Page 201 and 202:
Chapter IIIEU Migration Policy towa
- Page 203 and 204:
Chapter IIIEU Migration Policy towa
- Page 205 and 206:
Chapter IIIEU Migration Policy towa
- Page 207:
Chapter IIIEU Migration Policy towa