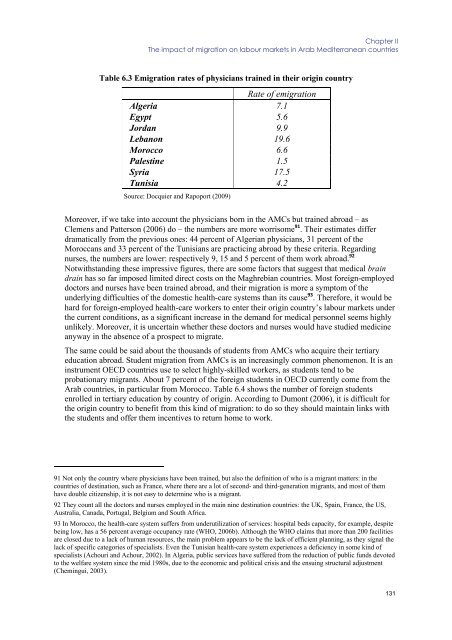
<strong>European</strong> CommissionOccasional Paper 60, Volume IMENA region would have been higher in a hypothetical scenario without e<strong>migration</strong>, butunemployment rates remain high, <strong>and</strong> this has greatly softened the potential positive impact of<strong>migration</strong> on domestic wages. This suggests that the opportunity cost of the <strong>migration</strong> of universitygraduates is low; the majority of skilled migrants who decided to migrate were unemployed oremployed in the public sector. This also means that skilled <strong>migration</strong> does not create a brain draineffect <strong>and</strong>, probably, that it reduces the public wage bill (World Bank, 2008a). Table 6.1 suggeststhat Egypt has the highest selection rate among AMCs, <strong>and</strong> this can be traced back to the highunemployment rate among educated working age individuals. A comparison between Egypt <strong>and</strong>Morocco shows that there is a positive relationship between education level <strong>and</strong> the chances ofbeing unemployed in Egypt, while a similar relationship does not exist in Morocco (World Bank,2008a). Still, Boudarbat (2004) shows that the unemployment rate of Moroccan universitygraduates was, in 2000, about four times the rate of individuals with less than six years ofschooling. Indeed, Sorenson (2004) reports that the Moroccan government depicted <strong>migration</strong> as asolution to the problem of widespread underemployment <strong>and</strong> unemployment of the domesticworkforce in official documents.Other features of the <strong>migration</strong> process can produce more substantial impacts on the labour force,namely its uneven gender profile <strong>and</strong> the <strong>migration</strong> of workers out of specific sectors. As far asgender is concerned, <strong>migration</strong> can lead to a worsening wage gap – <strong>and</strong> a worsening too of otherlabour <strong>market</strong> outcomes, such as participation <strong>and</strong> unemployment rates – across genders, 89although such an effect – which is due to the uneven impact of <strong>migration</strong> on the endowments ofmale <strong>and</strong> female labour 90 – can be counteracted by the effects that <strong>migration</strong> exerts on the behavioron the labor <strong>market</strong>, possibly reducing female participation (see Section 7.1).Does <strong>migration</strong> create relevant shortages of workers in some sectors in AMCs? World Bank(2008a) argues that <strong>migration</strong> does not create bottlenecks in the domestic <strong>market</strong> of Middle Eastern<strong>and</strong> North African countries. Nevertheless, such a general statement should not lead us to overlookspecific instances of possible shortages. Doquier <strong>and</strong> Rapoport (2009) report data on researchersemployed in the science <strong>and</strong> technology sector in the United States: the number of Tunisiansworking there is 0.17 times the number of researchers working in Tunisia, <strong>and</strong> the correspondingfigure for Algeria is 0.25 times. Khelfaoui (2006), finds that engineers <strong>and</strong> scientists are the mostcommon professional category of Algerians in the United States, though they may not be employedaccording to their qualifications.It is also worthwhile paying a closer look at what happens to health workers. Docquier <strong>and</strong>Bhargawa (2007) collect data from 16 receiving OECD countries, <strong>and</strong> they define the totalphysician e<strong>migration</strong> rate of a country as the ratio between the stock of national physicians workingabroad <strong>and</strong> the number of physicians trained in the home country, thus excluding those trained inthe host country. The figures we present here represent an update of Docquier <strong>and</strong> Bhargawa(2007) presented by Doquier <strong>and</strong> Rapoport (2009), where the authors have added South Africa tothe destination countries.We observe in Table 6.3 that the percentage of physicians abroad – as far as a selected group ofOECD countries is concerned – is very high only for Lebanon <strong>and</strong> Syria. Estimates from the Arab-American Medical Association show that there are 15,000 Arab physicians in the United States,<strong>and</strong> 6,000 of them come from Syria (Kawakibi, 2009). Nevertheless, we have to keep in mind thedata limitations, as Achouri <strong>and</strong> Achour (2002), for example, point out that most Tunisianphysicians who migrate go to Saudi Arabia.89 UNDP (2006) observes that “in Jordan, for example, women university graduates earn 71 per cent of the amount earnedby males in the same cohort; this drops to 50 per cent among those who have completed basic education only, while illiteratewomen earn less than 33 per cent of male wages (Moghadam, 2005)”.90 The existing gender gap in <strong>migration</strong> <strong>flows</strong> out of AMCs could be off set by the steady growth in dem<strong>and</strong> for jobs, such ashousework <strong>and</strong> the care of the elderly, which are usually taken by women in <strong>European</strong> countries (Al Ali, 2004).130
Chapter IIThe impact of <strong>migration</strong> on labour <strong>market</strong>s in Arab Mediterranean countriesTable 6.3 E<strong>migration</strong> rates of physicians trained in their origin countryRate of e<strong>migration</strong>Algeria 7.1Egypt 5.6Jordan 9.9Lebanon 19.6Morocco 6.6Palestine 1.5Syria 17.5Tunisia 4.2Source: Docquier <strong>and</strong> Rapoport (2009)Moreover, if we take into account the physicians born in the AMCs but trained abroad – asClemens <strong>and</strong> Patterson (2006) do – the numbers are more worrisome 91 . Their estimates differdramatically from the previous ones: 44 percent of Algerian physicians, 31 percent of theMoroccans <strong>and</strong> 33 percent of the Tunisians are practicing abroad by these criteria. Regardingnurses, the numbers are lower: respectively 9, 15 <strong>and</strong> 5 percent of them work abroad. 92Notwithst<strong>and</strong>ing these impressive figures, there are some factors that suggest that medical braindrain has so far imposed limited direct costs on the Maghrebian countries. Most foreign-employeddoctors <strong>and</strong> nurses have been trained abroad, <strong>and</strong> their <strong>migration</strong> is more a symptom of theunderlying difficulties of the domestic health-care systems than its cause 93 . Therefore, it would behard for foreign-employed health-care workers to enter their origin country’s labour <strong>market</strong>s underthe current conditions, as a significant increase in the dem<strong>and</strong> for medical personnel seems highlyunlikely. Moreover, it is uncertain whether these doctors <strong>and</strong> nurses would have studied medicineanyway in the absence of a prospect to migrate.The same could be said about the thous<strong>and</strong>s of students from AMCs who acquire their tertiaryeducation abroad. Student <strong>migration</strong> from AMCs is an increasingly common phenomenon. It is aninstrument OECD countries use to select highly-skilled workers, as students tend to beprobationary migrants. About 7 percent of the foreign students in OECD currently come from theArab countries, in particular from Morocco. Table 6.4 shows the number of foreign studentsenrolled in tertiary education by country of origin. According to Dumont (2006), it is difficult forthe origin country to benefit from this kind of <strong>migration</strong>: to do so they should maintain links withthe students <strong>and</strong> offer them incentives to return home to work.91 Not only the country where physicians have been trained, but also the definition of who is a migrant matters: in thecountries of destination, such as France, where there are a lot of second- <strong>and</strong> third-generation migrants, <strong>and</strong> most of themhave double citizenship, it is not easy to determine who is a migrant.92 They count all the doctors <strong>and</strong> nurses employed in the main nine destination countries: the UK, Spain, France, the US,Australia, Canada, Portugal, Belgium <strong>and</strong> South Africa.93 In Morocco, the health-care system suffers from underutilization of services: hospital beds capacity, for example, despitebeing low, has a 56 percent average occupancy rate (WHO, 2006b). Although the WHO claims that more than 200 facilitiesare closed due to a lack of human resources, the main problem appears to be the lack of efficient planning, as they signal thelack of specific categories of specialists. Even the Tunisian health-care system experiences a deficiency in some kind ofspecialists (Achouri <strong>and</strong> Achour, 2002). In Algeria, public services have suffered from the reduction of public funds devotedto the welfare system since the mid 1980s, due to the economic <strong>and</strong> political crisis <strong>and</strong> the ensuing structural adjustment(Chemingui, 2003).131
- Page 5 and 6:
STUDYLABOUR MARKETS PERFORMANCE AND
- Page 7 and 8:
Table of ContentsLABOUR MARKETS PER
- Page 10:
8.1 Actual migration and consumptio
- Page 15 and 16:
Chapter IFinal Report 15 MILLION NE
- Page 17 and 18:
Chapter IFinal Report …so that MI
- Page 19 and 20:
Chapter IFinal Reportroots). The cu
- Page 21 and 22:
Chapter IFinal Report In AMCs, REMI
- Page 23 and 24:
Chapter IFinal Reportpolicies. This
- Page 25 and 26:
Chapter IFinal ReportMediterranean
- Page 27 and 28:
Chapter IFinal ReportMore recently,
- Page 29 and 30:
Chapter IFinal Reportfor EU employm
- Page 31 and 32:
Chapter IFinal Reportchosen, these
- Page 33 and 34:
Chapter IFinal Reportexit of women
- Page 35 and 36:
Chapter IFinal ReportFigure 1.2.1.
- Page 37 and 38:
Chapter IFinal ReportA Declining Em
- Page 39 and 40:
Chapter IFinal ReportThe same year,
- Page 41 and 42:
Chapter IFinal ReportTable 2.2.1. I
- Page 43 and 44:
Chapter IFinal Reportminimum wages
- Page 45 and 46:
Chapter IFinal Report2.4 Unemployme
- Page 47 and 48:
Chapter IFinal ReportYouth Unemploy
- Page 49 and 50:
Chapter IFinal ReportBut one should
- Page 51 and 52:
Chapter IFinal Reportmillion) 10 .
- Page 53 and 54:
Chapter IFinal Reportmight intensif
- Page 55 and 56:
Chapter IFinal Reporttrue labour ma
- Page 57 and 58:
Chapter IFinal Reportto reform the
- Page 59 and 60:
Chapter IFinal ReportFrom a differe
- Page 61 and 62:
Chapter IFinal ReportTable 4.2.1 Ou
- Page 63 and 64:
Chapter IFinal ReportSource: Adams
- Page 65 and 66:
Chapter IFinal Reportin the destina
- Page 67 and 68:
Chapter IFinal ReportIn conclusion,
- Page 69 and 70:
Chapter IFinal Reportorganised in B
- Page 71 and 72:
Chapter IFinal Reportsecond Intifad
- Page 73 and 74:
Chapter IFinal Reportstands at 29.7
- Page 75 and 76:
Chapter IFinal Reportconstruction w
- Page 77 and 78:
Chapter IFinal ReportAs far as the
- Page 79 and 80:
Chapter IFinal Reportother cases, l
- Page 81 and 82: Chapter IFinal Reportunemployment a
- Page 83 and 84: Chapter IFinal Reportof Egypt, so f
- Page 85 and 86: Chapter IFinal ReportWhile progress
- Page 87 and 88: Chapter IFinal ReportThese reservat
- Page 89 and 90: Chapter IFinal ReportAs Figure 6.3.
- Page 91 and 92: Chapter IFinal Reportin skill devel
- Page 93 and 94: Chapter IFinal ReportThe Directive
- Page 95 and 96: Chapter IFinal ReportThe need for
- Page 97 and 98: Chapter IFinal Reportobjectives are
- Page 99 and 100: Chapter IFinal Reporttrue Euro-Medi
- Page 101 and 102: Chapter IFinal Report- Putting empl
- Page 103 and 104: Chapter IFinal Report promotion of
- Page 105 and 106: Chapter IFinal ReportOtherADAMS, R.
- Page 107 and 108: Chapter IFinal ReportDE BEL-AIR, F.
- Page 109 and 110: Chapter IFinal ReportGUPTA, S., C.
- Page 111 and 112: Chapter IFinal ReportOECD (2000): M
- Page 113 and 114: Chapter II - Thematic Background Pa
- Page 115 and 116: Chapter IIThe impact of migration o
- Page 117 and 118: Chapter IIThe impact of migration o
- Page 119 and 120: Chapter IIThe impact of migration o
- Page 121 and 122: Chapter IIThe impact of migration o
- Page 123 and 124: Chapter IIThe impact of migration o
- Page 125 and 126: Chapter IIThe impact of migration o
- Page 127 and 128: Chapter IIThe impact of migration o
- Page 129 and 130: Chapter IIThe impact of migration o
- Page 131: Chapter IIThe impact of migration o
- Page 135 and 136: Chapter IIThe impact of migration o
- Page 137 and 138: Chapter IIThe impact of migration o
- Page 139 and 140: Chapter IIThe impact of migration o
- Page 141 and 142: Chapter IIThe impact of migration o
- Page 143 and 144: Chapter IIThe impact of migration o
- Page 145 and 146: Chapter IIThe impact of migration o
- Page 147 and 148: Chapter IIThe impact of migration o
- Page 149 and 150: Chapter IIThe impact of migration o
- Page 151 and 152: Chapter IIThe impact of migration o
- Page 153 and 154: Chapter IIThe impact of migration o
- Page 155 and 156: Chapter IIThe impact of migration o
- Page 157 and 158: Chapter IIThe impact of migration o
- Page 159 and 160: Chapter IIThe impact of migration o
- Page 161 and 162: Chapter III - Thematic Background P
- Page 163 and 164: Chapter IIIEU Migration Policy towa
- Page 165 and 166: Chapter IIIEU Migration Policy towa
- Page 167 and 168: Chapter IIIEU Migration Policy towa
- Page 169 and 170: Chapter IIIEU Migration Policy towa
- Page 171 and 172: Chapter IIIEU Migration Policy towa
- Page 173 and 174: Chapter IIIEU Migration Policy towa
- Page 175 and 176: Chapter IIIEU Migration Policy towa
- Page 177 and 178: Chapter IIIEU Migration Policy towa
- Page 179 and 180: Chapter IIIEU Migration Policy towa
- Page 181 and 182: Chapter IIIEU Migration Policy towa
- Page 183 and 184:
Chapter IIIEU Migration Policy towa
- Page 185 and 186:
Chapter IIIEU Migration Policy towa
- Page 187 and 188:
Chapter IIIEU Migration Policy towa
- Page 189 and 190:
Chapter IIIEU Migration Policy towa
- Page 191 and 192:
Chapter IIIEU Migration Policy towa
- Page 193 and 194:
Chapter IIIEU Migration Policy towa
- Page 195 and 196:
Chapter IIIEU Migration Policy towa
- Page 197 and 198:
Chapter IIIEU Migration Policy towa
- Page 199 and 200:
Chapter IIIEU Migration Policy towa
- Page 201 and 202:
Chapter IIIEU Migration Policy towa
- Page 203 and 204:
Chapter IIIEU Migration Policy towa
- Page 205 and 206:
Chapter IIIEU Migration Policy towa
- Page 207:
Chapter IIIEU Migration Policy towa