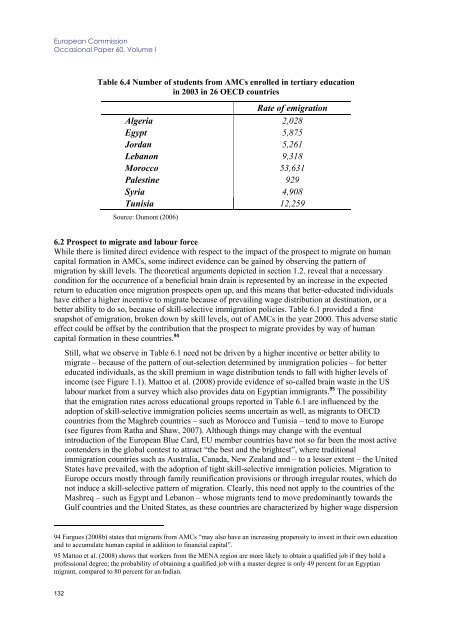
<strong>European</strong> CommissionOccasional Paper 60, Volume ITable 6.4 Number of students from AMCs enrolled in tertiary educationin 2003 in 26 OECD countriesRate of e<strong>migration</strong>Algeria 2,028Egypt 5,875Jordan 5,261Lebanon 9,318Morocco 53,631Palestine 929Syria 4,908Tunisia 12,259Source: Dumont (2006)6.2 Prospect to migrate <strong>and</strong> labour forceWhile there is limited direct evidence with respect to the impact of the prospect to migrate on humancapital formation in AMCs, some indirect evidence can be gained by observing the pattern of<strong>migration</strong> by skill levels. The theoretical arguments depicted in section 1.2. reveal that a necessarycondition for the occurrence of a beneficial brain drain is represented by an increase in the expectedreturn to education once <strong>migration</strong> prospects open up, <strong>and</strong> this means that better-educated individualshave either a higher incentive to migrate because of prevailing wage distribution at destination, or abetter ability to do so, because of skill-selective im<strong>migration</strong> policies. Table 6.1 provided a firstsnapshot of e<strong>migration</strong>, broken down by skill levels, out of AMCs in the year 2000. This adverse staticeffect could be offset by the contribution that the prospect to migrate provides by way of humancapital formation in these countries. 94Still, what we observe in Table 6.1 need not be driven by a higher incentive or better ability tomigrate – because of the pattern of out-selection determined by im<strong>migration</strong> policies – for bettereducated individuals, as the skill premium in wage distribution tends to fall with higher levels ofincome (see Figure 1.1). Mattoo et al. (2008) provide evidence of so-called brain waste in the USlabour <strong>market</strong> from a survey which also provides data on Egyptian immigrants. 95 The possibilitythat the e<strong>migration</strong> rates across educational groups reported in Table 6.1 are influenced by theadoption of skill-selective im<strong>migration</strong> policies seems uncertain as well, as migrants to OECDcountries from the Maghreb countries – such as Morocco <strong>and</strong> Tunisia – tend to move to Europe(see figures from Ratha <strong>and</strong> Shaw, 2007). Although things may change with the eventualintroduction of the <strong>European</strong> Blue Card, EU member countries have not so far been the most activecontenders in the global contest to attract “the best <strong>and</strong> the brightest”, where traditionalim<strong>migration</strong> countries such as Australia, Canada, New Zeal<strong>and</strong> <strong>and</strong> – to a lesser extent – the UnitedStates have prevailed, with the adoption of tight skill-selective im<strong>migration</strong> policies. Migration toEurope occurs mostly through family reunification provisions or through irregular routes, which donot induce a skill-selective pattern of <strong>migration</strong>. Clearly, this need not apply to the countries of theMashreq – such as Egypt <strong>and</strong> Lebanon – whose migrants tend to move predominantly towards theGulf countries <strong>and</strong> the United States, as these countries are characterized by higher wage dispersion94 Fargues (2008b) states that migrants from AMCs “may also have an increasing propensity to invest in their own education<strong>and</strong> to accumulate human capital in addition to financial capital”.95 Mattoo et al. (2008) shows that workers from the MENA region are more likely to obtain a qualified job if they hold aprofessional degree; the probability of obtaining a qualified job with a master degree is only 49 percent for an Egyptianmigrant, compared to 80 percent for an Indian.132
Chapter IIThe impact of <strong>migration</strong> on labour <strong>market</strong>s in Arab Mediterranean countriesacross skill levels than as the case with most OECD member countries. Egyptian <strong>and</strong> Lebanesewould-be migrants can be induced to invest more in higher education by the prospect to migrate,<strong>and</strong> also to adjust the profile of their education to better match labour dem<strong>and</strong> in the countries ofdestination. 96Nassar (2005) observes that half of Egyptian temporary migrants reside in Saudi Arabia, whileLibya, Jordan, Kuwait <strong>and</strong> Iraq host the rest of the temporary migrant population, which, accordingto OIM (2003), represents the prevailing pattern of Egyptian <strong>migration</strong>. 97 Temporary migrants are,on average, better educated than those who remain in the home country, <strong>and</strong> the composition of the<strong>migration</strong> <strong>flows</strong> has changed producing a larger share of scientists <strong>and</strong> technicians since 1985, whocurrently represent about 40 percent of the total. For instance, 69.1 percent of Egyptian migrants toYemen are technicians or scientists, while the corresponding figure for the main destination, e.g.Saudi Arabia, st<strong>and</strong>s at 40.5 percent (Nassar, 2005). As Section 5 demonstrated, the temporarycharacter of <strong>migration</strong> from AMCs to the Gulf is due to the fact that destination countries do notgrant citizenship to immigrants, whose length of stay at destination can actually be long enough tosupport the argument that individual educational decisions in the home country are sensitive to theprospect to migrate.As far as Jordan is concerned, Chatelard (2004) observes that there is still much dem<strong>and</strong> for highlyskilledworkers in the Gulf, while adequate employment prospects at home are limited for younggraduates, as De Bel Air (2008) argues. This means that we can safely assume that <strong>migration</strong> is away to improve on these low expectations, <strong>and</strong> to drive up educational investments, which willotherwise be wasted because of the domestic labour <strong>market</strong> conditions. A similar argument can beadvanced too in the case of Lebanon: the number of young, qualified individuals who wish to get aforeign job has increased, as – after the 2006 war with Israel – “insecurity pushes towards the braindrain” (Hourani <strong>and</strong> Sensening-Dabbous, 2007), <strong>and</strong> 35 percent of managerial positions ininternational enterprises located in the Gulf countries are taken up by Lebanese workers(Kasparian, 2008). 98These arguments suggest that the common pattern of e<strong>migration</strong> rates across educational groupsthat we observe for AMCs could be driven by different factors: while for Mashreq countries thehigher e<strong>migration</strong> rate for higher-educated individuals may suggest that the conditions for abeneficial brain drain 99 are in place, this is not the case for the Maghreb countries, where thepattern observed in Table 6.1 is likely to be due to the correlation between education <strong>and</strong> income.Individuals with a better level of education self-select themselves as migrants because they arebetter able to afford <strong>migration</strong> costs, but this does not lead to any beneficial brain drain dynamics.Still, even as far as Mashreq countries are concerned, we need to remind ourselves that theinfluence of the prospect to migrate on human-capital formation at home is directly related to thelength of individual <strong>migration</strong> episodes.96 The Egyptian university system has undergone some changes which partly reflect its reaction to the foreign dem<strong>and</strong> fordomestic workers; specifically, to avoid the occurrence of substantial leakages of fiscal resources to the countries ofdestination, it has progressively, albeit indirectly, increased cost-sharing in higher education, though tuition fees still remain apolitical taboo (Vossensteyn, 2004).97 Although im<strong>migration</strong>-based statistics seem to suggest that OECD countries represent the largest cause of brain drain forEgypt (see Table 6.1 <strong>and</strong> 6.2), it is actually the Gulf countries <strong>and</strong> Libya which absorb most Egyptian skilled migrants, asIOM (2003) – quoted in Nassar (2005) – points out.98 A different argument applies to Syrian migrants: the majority of temporary migrants to the Gulf are young professionals(health professionals, engineers, <strong>and</strong> other qualified workers) who plan to stay for at least five years because this is the timethey need to be able to be entitled not to serve in the military, in exchange for a monetary payment out of the savings theyaccumulated abroad (Kawakibi, 2008).99 Note that this term refers simply to an increase in the human-capital endowment of the migrant-sending country as a resultof the prospect to migrate, but it does not per se mean that this is welfare-improving for the country, as discussed in section3.2.133
- Page 5 and 6:
STUDYLABOUR MARKETS PERFORMANCE AND
- Page 7 and 8:
Table of ContentsLABOUR MARKETS PER
- Page 10:
8.1 Actual migration and consumptio
- Page 15 and 16:
Chapter IFinal Report 15 MILLION NE
- Page 17 and 18:
Chapter IFinal Report …so that MI
- Page 19 and 20:
Chapter IFinal Reportroots). The cu
- Page 21 and 22:
Chapter IFinal Report In AMCs, REMI
- Page 23 and 24:
Chapter IFinal Reportpolicies. This
- Page 25 and 26:
Chapter IFinal ReportMediterranean
- Page 27 and 28:
Chapter IFinal ReportMore recently,
- Page 29 and 30:
Chapter IFinal Reportfor EU employm
- Page 31 and 32:
Chapter IFinal Reportchosen, these
- Page 33 and 34:
Chapter IFinal Reportexit of women
- Page 35 and 36:
Chapter IFinal ReportFigure 1.2.1.
- Page 37 and 38:
Chapter IFinal ReportA Declining Em
- Page 39 and 40:
Chapter IFinal ReportThe same year,
- Page 41 and 42:
Chapter IFinal ReportTable 2.2.1. I
- Page 43 and 44:
Chapter IFinal Reportminimum wages
- Page 45 and 46:
Chapter IFinal Report2.4 Unemployme
- Page 47 and 48:
Chapter IFinal ReportYouth Unemploy
- Page 49 and 50:
Chapter IFinal ReportBut one should
- Page 51 and 52:
Chapter IFinal Reportmillion) 10 .
- Page 53 and 54:
Chapter IFinal Reportmight intensif
- Page 55 and 56:
Chapter IFinal Reporttrue labour ma
- Page 57 and 58:
Chapter IFinal Reportto reform the
- Page 59 and 60:
Chapter IFinal ReportFrom a differe
- Page 61 and 62:
Chapter IFinal ReportTable 4.2.1 Ou
- Page 63 and 64:
Chapter IFinal ReportSource: Adams
- Page 65 and 66:
Chapter IFinal Reportin the destina
- Page 67 and 68:
Chapter IFinal ReportIn conclusion,
- Page 69 and 70:
Chapter IFinal Reportorganised in B
- Page 71 and 72:
Chapter IFinal Reportsecond Intifad
- Page 73 and 74:
Chapter IFinal Reportstands at 29.7
- Page 75 and 76:
Chapter IFinal Reportconstruction w
- Page 77 and 78:
Chapter IFinal ReportAs far as the
- Page 79 and 80:
Chapter IFinal Reportother cases, l
- Page 81 and 82:
Chapter IFinal Reportunemployment a
- Page 83 and 84: Chapter IFinal Reportof Egypt, so f
- Page 85 and 86: Chapter IFinal ReportWhile progress
- Page 87 and 88: Chapter IFinal ReportThese reservat
- Page 89 and 90: Chapter IFinal ReportAs Figure 6.3.
- Page 91 and 92: Chapter IFinal Reportin skill devel
- Page 93 and 94: Chapter IFinal ReportThe Directive
- Page 95 and 96: Chapter IFinal ReportThe need for
- Page 97 and 98: Chapter IFinal Reportobjectives are
- Page 99 and 100: Chapter IFinal Reporttrue Euro-Medi
- Page 101 and 102: Chapter IFinal Report- Putting empl
- Page 103 and 104: Chapter IFinal Report promotion of
- Page 105 and 106: Chapter IFinal ReportOtherADAMS, R.
- Page 107 and 108: Chapter IFinal ReportDE BEL-AIR, F.
- Page 109 and 110: Chapter IFinal ReportGUPTA, S., C.
- Page 111 and 112: Chapter IFinal ReportOECD (2000): M
- Page 113 and 114: Chapter II - Thematic Background Pa
- Page 115 and 116: Chapter IIThe impact of migration o
- Page 117 and 118: Chapter IIThe impact of migration o
- Page 119 and 120: Chapter IIThe impact of migration o
- Page 121 and 122: Chapter IIThe impact of migration o
- Page 123 and 124: Chapter IIThe impact of migration o
- Page 125 and 126: Chapter IIThe impact of migration o
- Page 127 and 128: Chapter IIThe impact of migration o
- Page 129 and 130: Chapter IIThe impact of migration o
- Page 131 and 132: Chapter IIThe impact of migration o
- Page 133: Chapter IIThe impact of migration o
- Page 137 and 138: Chapter IIThe impact of migration o
- Page 139 and 140: Chapter IIThe impact of migration o
- Page 141 and 142: Chapter IIThe impact of migration o
- Page 143 and 144: Chapter IIThe impact of migration o
- Page 145 and 146: Chapter IIThe impact of migration o
- Page 147 and 148: Chapter IIThe impact of migration o
- Page 149 and 150: Chapter IIThe impact of migration o
- Page 151 and 152: Chapter IIThe impact of migration o
- Page 153 and 154: Chapter IIThe impact of migration o
- Page 155 and 156: Chapter IIThe impact of migration o
- Page 157 and 158: Chapter IIThe impact of migration o
- Page 159 and 160: Chapter IIThe impact of migration o
- Page 161 and 162: Chapter III - Thematic Background P
- Page 163 and 164: Chapter IIIEU Migration Policy towa
- Page 165 and 166: Chapter IIIEU Migration Policy towa
- Page 167 and 168: Chapter IIIEU Migration Policy towa
- Page 169 and 170: Chapter IIIEU Migration Policy towa
- Page 171 and 172: Chapter IIIEU Migration Policy towa
- Page 173 and 174: Chapter IIIEU Migration Policy towa
- Page 175 and 176: Chapter IIIEU Migration Policy towa
- Page 177 and 178: Chapter IIIEU Migration Policy towa
- Page 179 and 180: Chapter IIIEU Migration Policy towa
- Page 181 and 182: Chapter IIIEU Migration Policy towa
- Page 183 and 184: Chapter IIIEU Migration Policy towa
- Page 185 and 186:
Chapter IIIEU Migration Policy towa
- Page 187 and 188:
Chapter IIIEU Migration Policy towa
- Page 189 and 190:
Chapter IIIEU Migration Policy towa
- Page 191 and 192:
Chapter IIIEU Migration Policy towa
- Page 193 and 194:
Chapter IIIEU Migration Policy towa
- Page 195 and 196:
Chapter IIIEU Migration Policy towa
- Page 197 and 198:
Chapter IIIEU Migration Policy towa
- Page 199 and 200:
Chapter IIIEU Migration Policy towa
- Page 201 and 202:
Chapter IIIEU Migration Policy towa
- Page 203 and 204:
Chapter IIIEU Migration Policy towa
- Page 205 and 206:
Chapter IIIEU Migration Policy towa
- Page 207:
Chapter IIIEU Migration Policy towa