Labour market performance and migration flows - European ...
Labour market performance and migration flows - European ...
Labour market performance and migration flows - European ...
Create successful ePaper yourself
Turn your PDF publications into a flip-book with our unique Google optimized e-Paper software.
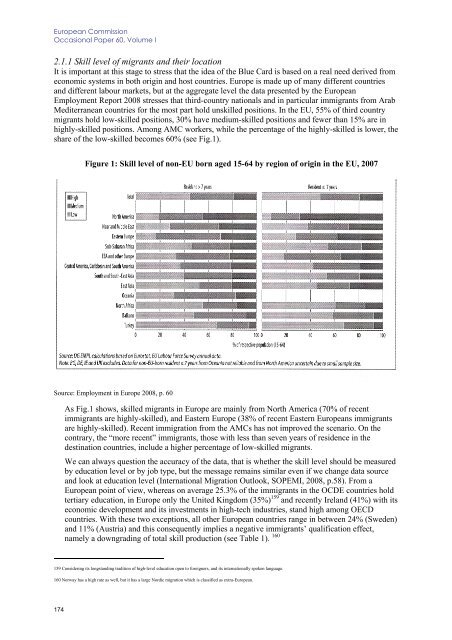
<strong>European</strong> CommissionOccasional Paper 60, Volume I2.1.1 Skill level of migrants <strong>and</strong> their locationIt is important at this stage to stress that the idea of the Blue Card is based on a real need derived fromeconomic systems in both origin <strong>and</strong> host countries. Europe is made up of many different countries<strong>and</strong> different labour <strong>market</strong>s, but at the aggregate level the data presented by the <strong>European</strong>Employment Report 2008 stresses that third-country nationals <strong>and</strong> in particular immigrants from ArabMediterranean countries for the most part hold unskilled positions. In the EU, 55% of third countrymigrants hold low-skilled positions, 30% have medium-skilled positions <strong>and</strong> fewer than 15% are inhighly-skilled positions. Among AMC workers, while the percentage of the highly-skilled is lower, theshare of the low-skilled becomes 60% (see Fig.1).Figure 1: Skill level of non-EU born aged 15-64 by region of origin in the EU, 2007Source: Employment in Europe 2008, p. 60As Fig.1 shows, skilled migrants in Europe are mainly from North America (70% of recentimmigrants are highly-skilled), <strong>and</strong> Eastern Europe (38% of recent Eastern <strong>European</strong>s immigrantsare highly-skilled). Recent im<strong>migration</strong> from the AMCs has not improved the scenario. On thecontrary, the “more recent” immigrants, those with less than seven years of residence in thedestination countries, include a higher percentage of low-skilled migrants.We can always question the accuracy of the data, that is whether the skill level should be measuredby education level or by job type, but the message remains similar even if we change data source<strong>and</strong> look at education level (International Migration Outlook, SOPEMI, 2008, p.58). From a<strong>European</strong> point of view, whereas on average 25.3% of the immigrants in the OCDE countries holdtertiary education, in Europe only the United Kingdom (35%) 159 <strong>and</strong> recently Irel<strong>and</strong> (41%) with itseconomic development <strong>and</strong> its investments in high-tech industries, st<strong>and</strong> high among OECDcountries. With these two exceptions, all other <strong>European</strong> countries range in between 24% (Sweden)<strong>and</strong> 11% (Austria) <strong>and</strong> this consequently implies a negative immigrants’ qualification effect,namely a downgrading of total skill production (see Table 1). 160159 Considering its longst<strong>and</strong>ing tradition of high-level education open to foreigners, <strong>and</strong> its internationally spoken language.160 Norway has a high rate as well, but it has a large Nordic <strong>migration</strong> which is classified as extra-<strong>European</strong>.174


