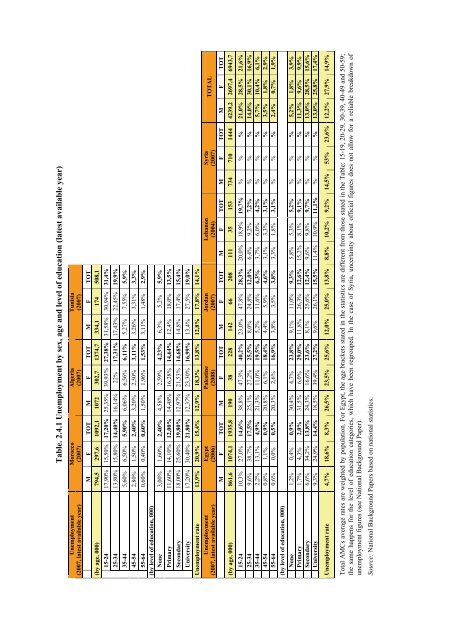
Table. 2.4.1 Unemployment by sex, age <strong>and</strong> level of education (latest available year)Unemployment(2007, latest available year)Morocco(2007)Algeria(2007)Tunisia(2007)M F TOT M F TOT M F TOT(by age, 000) 794,5 297,6 1092,1 1072 302,7 1374,7 334,1 174 508,115-24 17,90%25-34 13,80%35-44 5,60%45-54 2,80%55-64 0,60%(by level of education, 000)None 3,00%Primary 11,60%Secondary 18,00%University 17,20%15,50% 17,20% 25,35% 39,93% 27,38% 31,58% 30,94% 31,4%15,80% 14,40% 16,14% 22% 17,31% 17,43% 22,45% 19,9%6,50% 5,90% 6,06% 6,56% 6,11% 5,27% 7,55% 5,9%1,50% 2,40% 3,20% 2,50% 3,11% 3,26% 3,31% 3,3%0,40% 0,60% 1,50% 1,96% 1,53% 3,11% 1,48% 2,9%1,60% 2,40% 4,58% 2,59% 4,23% 6,3% 5,2% 5,9%14,10% 12,00% 14,48% 16,28% 14,64% 12,4% 18,0% 13,5%25,60% 19,80% 12,97% 21,53% 14,68% 14,8% 17,4% 15,4%30,40% 21,80% 12,37% 23,30% 16,99% 13,4% 27,5% 19,0%Unemployment rate 13,9% 20,9% 15,4% 12,9% 18,3% 13,8% 12,8% 17,8% 14,1%Unemployment(2007, latest available year)Egypt(2006)Palestine(2008)Jordan(2007)Lebanon(2004)M F TOT M F TOT M F TOT M F TOT M F TOT M F TOT(by age, 000) 861,6 1074,1 1935,8 190 38 228 142 66 208 111 35 153 734 710 1444 4239,2 2697,4 6943,715-24 10,3%25-34 9,6%35-44 2,2%45-54 0,8%55-64 0,6%(by level of education, 000)None 1,2%Primary 1,7%Secondary 6,6%University 9,3%Syria(2007)TOTAL27,0% 14,6% 38,8% 47,3% 40,2% 38,7% 17,5% 13,1% 4,9% 1,1% 0,9% 0,0% 0,5% 23,0% 47,8% 28,3% 20,0% 18,9% 19,7% % % % 21,0% 28,5% 21,6%25,1% 27,2% 25,5% 8,0% 24,8% 12,0% 6,4% 9,2% 7,2% % % % 14,0% 30,1% 16,9%21,3% 11,0% 19,5% 5,2% 11,6% 6,3% 3,7% 6,0% 4,2% % % % 5,7% 10,4% 6,1%20,8% 6,1% 18,4% 4,4% 5,9% 4,6% 3,1% 3,3% 3,1% % % % 3,5% 1,8% 2,9%20,3% 2,6% 16,9% 3,8% 3,5% 3,8% 3,3% 1,8% 3,1% % % % 2,4% 0,7% 1,9%0,4% 0,9% 30,4% 4,7% 23,8% 4,3% 2,0% 34,2% 13,8% 24,9% 14,4% 9,1% 11,0% 9,3% 5,8% 5,3% 5,2% % % % 5,2% 1,8% 3,9%31,5% 6,0% 29,0% 11,8% 26,3% 12,6% 15,2% 8,1% 9,1% % % % 11,3% 9,6% 9,9%24,3% 16,6% 23,6% 8,1% 25,6% 12,4% 9,6% 9,8% 9,7% % % % 13,0% 28,5% 15,6%18,5% 39,4% 27,2% 9,6% 26,1% 15,5% 11,4% 10,9% 11,1% % % % 13,0% 25,8% 17,4%Unemployment rate 4,7% 18,6% 8,3% 26,5% 23,5% 25,6% 12,0% 25,0% 13,8% 8,8% 10,2% 9,2% 14,5% 53% 23,6% 12,2% 27,9% 14,9%Total AMCs average rates are weighted by population. For Egypt, the age brackets stated in the statistics are different from those stated in the Table: 15-19, 20-29, 30-39, 40-49 <strong>and</strong> 50-59;the same happens for the level of education categories, which have been regrouped. In the case of Syria, uncertainty about official figures does not allow for a reliable breakdown ofunemployment figures (see National Background Paper).Source: National Background Papers based on national statistics.
Chapter IFinal ReportYouth UnemploymentAn important characteristic of unemployment in AMCs is its young face. The average unemploymentrate in AMCs for the 15-24 age bracket is 21.6%, well over the world average of 14%. So the young inthese countries comprise between 70 <strong>and</strong> 80% of all the unemployed 8 . It is this age bracket too that hasthe highest propensity towards <strong>migration</strong>. The risks of youth unemployment for social instability arewell known 9 , <strong>and</strong> in AMCs the share of youths between 15 <strong>and</strong> 24 who are neither active participantsin the labour force nor in education is estimated at 15% for males <strong>and</strong> 47% for females. But theeconomic costs of this labour <strong>market</strong> exclusion should not be underestimated either. Based on theassumption that youths earn on average 80% of the average national wage, <strong>and</strong>, in addition, thatfemales earn on average 25% less than males, it is possible to calculate the exact financial impact on anational economy of excluding youths from the job <strong>market</strong> (Chaaban 2008, p. 8). If it is assumed thatyouth unemployment should be equivalent to adult unemployment (as zero unemployment amongyouths is arguably unrealistic), youth unemployment is costing Algeria 1.76% of its GDP annually,Egypt 1.38%, Jordan 1.84%, Lebanon 1.07 %, Morocco 3.6%, Syria 2.36% <strong>and</strong> Palestine 1.69% inforegone earnings, with a total yearly cost for these seven countries of 14.4 billion US$ (in PPP)(ibid.). The cost of male youth unemployment is more than twice as high as that of female youthunemployment. This is, to a large extent, the result of fewer females participating in the activeworkforce. If this gauge of youth exclusion is exp<strong>and</strong>ed so as to examine the cost of youth inactivity,the figure grows significantly. The definition of the joblessness rate includes the officialunemployment rate as well as the inactivity rate of youths who are not engaged in education. Such ameasure is perhaps more illustrative of the real costs involved in the inability of youths to successfullyenter the job <strong>market</strong>. In the case of AMCs, based on the same assumptions as above, youth joblessnessis costing Syria 9.09% of its GDP yearly, Egypt 7.29%, Jordan 4.14% <strong>and</strong> Lebanon 2.74%, an annualcost of 28.8 billion US$ (in PPP). These figures highlight the fact that hardly any other policy measurecould make a bigger contribution to the economic development of those countries than the promotionof youth employment.Beyond its economic cost, youth unemployment is also consolidating the generational gap <strong>and</strong> thesegmentation of the labour <strong>market</strong>, where the insider/outsider dynamic tends to prevail. The decline inunemployment rates in higher age groups (see Table 2.4.1.) reflects two factors: first, the problemsfacing young persons when they enter the labour <strong>market</strong>, in terms of the aforementioned mismatch ineducation <strong>and</strong> skills <strong>and</strong> the long period necessary to find a job. Second, to an increasing extent, atleast in certain countries, the <strong>migration</strong> of young workers of 25 <strong>and</strong> above helps lower theunemployment rate, as it tends to ‘evacuate’ persons who cannot find a job on the local <strong>market</strong>.Many reasons could explain high unemployment rates among young workers. On the dem<strong>and</strong> side,a scarcity of entry-level opportunities for young people in the productive sectors stems from factorsincluding economic instability <strong>and</strong> the deterioration of macro-economic conditions (inflation, budgetdeficit <strong>and</strong> public debt); <strong>and</strong> the recruitment practices of employers, who frequently resort to personalcontacts, thereby reinforcing the perception of a lack of opportunity. On the supply side, the mostimportant factors are the gap between the skills of the new entrants to the labour force (professionaltraining <strong>and</strong> a high level of education) <strong>and</strong> the labour <strong>market</strong> needs, as well as the reluctance of youngworkers to accept low-skilled jobs with poor wages <strong>and</strong> working conditions. The lack of an effectiveguidance <strong>and</strong> orientation system <strong>and</strong> the lack of internship opportunities to gain work experience alsoplay a role. This situation has led to a mismatch between the dem<strong>and</strong> for <strong>and</strong> the supply of labour.8 Youth unemployment data fr m National Background Papers are substantially lower than rates registered, for instance, in the Arab <strong>Labour</strong> Organization database: over 45% for Algeriaoin 2005/2006, 39% f r Jordan, 33% for Palestine, 27% for Tunisia <strong>and</strong> 26% for Egypt, 22% for Lebanon <strong>and</strong> 20% for Syria <strong>and</strong> 16% for Morocco (UNDP 2009, p. 109).o9 The last Arab Human Development Report underlines the threat to human security in Arab States derived from youth unemployment (UNDP 2009, pp. 10-11 <strong>and</strong> 108-111).45
- Page 5 and 6: STUDYLABOUR MARKETS PERFORMANCE AND
- Page 7 and 8: Table of ContentsLABOUR MARKETS PER
- Page 10: 8.1 Actual migration and consumptio
- Page 15 and 16: Chapter IFinal Report 15 MILLION NE
- Page 17 and 18: Chapter IFinal Report …so that MI
- Page 19 and 20: Chapter IFinal Reportroots). The cu
- Page 21 and 22: Chapter IFinal Report In AMCs, REMI
- Page 23 and 24: Chapter IFinal Reportpolicies. This
- Page 25 and 26: Chapter IFinal ReportMediterranean
- Page 27 and 28: Chapter IFinal ReportMore recently,
- Page 29 and 30: Chapter IFinal Reportfor EU employm
- Page 31 and 32: Chapter IFinal Reportchosen, these
- Page 33 and 34: Chapter IFinal Reportexit of women
- Page 35 and 36: Chapter IFinal ReportFigure 1.2.1.
- Page 37 and 38: Chapter IFinal ReportA Declining Em
- Page 39 and 40: Chapter IFinal ReportThe same year,
- Page 41 and 42: Chapter IFinal ReportTable 2.2.1. I
- Page 43 and 44: Chapter IFinal Reportminimum wages
- Page 45: Chapter IFinal Report2.4 Unemployme
- Page 49 and 50: Chapter IFinal ReportBut one should
- Page 51 and 52: Chapter IFinal Reportmillion) 10 .
- Page 53 and 54: Chapter IFinal Reportmight intensif
- Page 55 and 56: Chapter IFinal Reporttrue labour ma
- Page 57 and 58: Chapter IFinal Reportto reform the
- Page 59 and 60: Chapter IFinal ReportFrom a differe
- Page 61 and 62: Chapter IFinal ReportTable 4.2.1 Ou
- Page 63 and 64: Chapter IFinal ReportSource: Adams
- Page 65 and 66: Chapter IFinal Reportin the destina
- Page 67 and 68: Chapter IFinal ReportIn conclusion,
- Page 69 and 70: Chapter IFinal Reportorganised in B
- Page 71 and 72: Chapter IFinal Reportsecond Intifad
- Page 73 and 74: Chapter IFinal Reportstands at 29.7
- Page 75 and 76: Chapter IFinal Reportconstruction w
- Page 77 and 78: Chapter IFinal ReportAs far as the
- Page 79 and 80: Chapter IFinal Reportother cases, l
- Page 81 and 82: Chapter IFinal Reportunemployment a
- Page 83 and 84: Chapter IFinal Reportof Egypt, so f
- Page 85 and 86: Chapter IFinal ReportWhile progress
- Page 87 and 88: Chapter IFinal ReportThese reservat
- Page 89 and 90: Chapter IFinal ReportAs Figure 6.3.
- Page 91 and 92: Chapter IFinal Reportin skill devel
- Page 93 and 94: Chapter IFinal ReportThe Directive
- Page 95 and 96: Chapter IFinal ReportThe need for
- Page 97 and 98:
Chapter IFinal Reportobjectives are
- Page 99 and 100:
Chapter IFinal Reporttrue Euro-Medi
- Page 101 and 102:
Chapter IFinal Report- Putting empl
- Page 103 and 104:
Chapter IFinal Report promotion of
- Page 105 and 106:
Chapter IFinal ReportOtherADAMS, R.
- Page 107 and 108:
Chapter IFinal ReportDE BEL-AIR, F.
- Page 109 and 110:
Chapter IFinal ReportGUPTA, S., C.
- Page 111 and 112:
Chapter IFinal ReportOECD (2000): M
- Page 113 and 114:
Chapter II - Thematic Background Pa
- Page 115 and 116:
Chapter IIThe impact of migration o
- Page 117 and 118:
Chapter IIThe impact of migration o
- Page 119 and 120:
Chapter IIThe impact of migration o
- Page 121 and 122:
Chapter IIThe impact of migration o
- Page 123 and 124:
Chapter IIThe impact of migration o
- Page 125 and 126:
Chapter IIThe impact of migration o
- Page 127 and 128:
Chapter IIThe impact of migration o
- Page 129 and 130:
Chapter IIThe impact of migration o
- Page 131 and 132:
Chapter IIThe impact of migration o
- Page 133 and 134:
Chapter IIThe impact of migration o
- Page 135 and 136:
Chapter IIThe impact of migration o
- Page 137 and 138:
Chapter IIThe impact of migration o
- Page 139 and 140:
Chapter IIThe impact of migration o
- Page 141 and 142:
Chapter IIThe impact of migration o
- Page 143 and 144:
Chapter IIThe impact of migration o
- Page 145 and 146:
Chapter IIThe impact of migration o
- Page 147 and 148:
Chapter IIThe impact of migration o
- Page 149 and 150:
Chapter IIThe impact of migration o
- Page 151 and 152:
Chapter IIThe impact of migration o
- Page 153 and 154:
Chapter IIThe impact of migration o
- Page 155 and 156:
Chapter IIThe impact of migration o
- Page 157 and 158:
Chapter IIThe impact of migration o
- Page 159 and 160:
Chapter IIThe impact of migration o
- Page 161 and 162:
Chapter III - Thematic Background P
- Page 163 and 164:
Chapter IIIEU Migration Policy towa
- Page 165 and 166:
Chapter IIIEU Migration Policy towa
- Page 167 and 168:
Chapter IIIEU Migration Policy towa
- Page 169 and 170:
Chapter IIIEU Migration Policy towa
- Page 171 and 172:
Chapter IIIEU Migration Policy towa
- Page 173 and 174:
Chapter IIIEU Migration Policy towa
- Page 175 and 176:
Chapter IIIEU Migration Policy towa
- Page 177 and 178:
Chapter IIIEU Migration Policy towa
- Page 179 and 180:
Chapter IIIEU Migration Policy towa
- Page 181 and 182:
Chapter IIIEU Migration Policy towa
- Page 183 and 184:
Chapter IIIEU Migration Policy towa
- Page 185 and 186:
Chapter IIIEU Migration Policy towa
- Page 187 and 188:
Chapter IIIEU Migration Policy towa
- Page 189 and 190:
Chapter IIIEU Migration Policy towa
- Page 191 and 192:
Chapter IIIEU Migration Policy towa
- Page 193 and 194:
Chapter IIIEU Migration Policy towa
- Page 195 and 196:
Chapter IIIEU Migration Policy towa
- Page 197 and 198:
Chapter IIIEU Migration Policy towa
- Page 199 and 200:
Chapter IIIEU Migration Policy towa
- Page 201 and 202:
Chapter IIIEU Migration Policy towa
- Page 203 and 204:
Chapter IIIEU Migration Policy towa
- Page 205 and 206:
Chapter IIIEU Migration Policy towa
- Page 207:
Chapter IIIEU Migration Policy towa