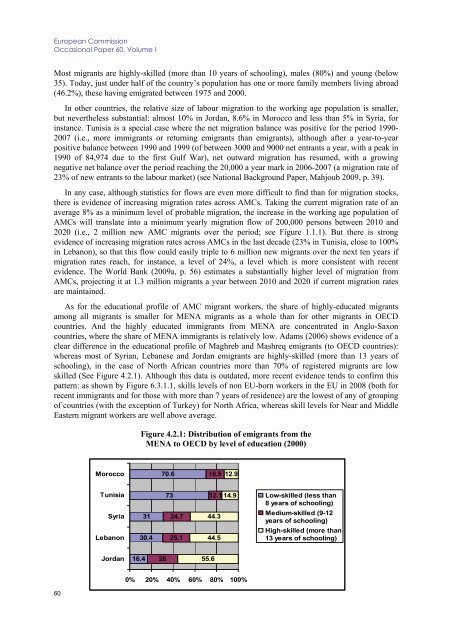
<strong>European</strong> CommissionOccasional Paper 60, Volume IMost migrants are highly-skilled (more than 10 years of schooling), males (80%) <strong>and</strong> young (below35). Today, just under half of the country’s population has one or more family members living abroad(46.2%), these having emigrated between 1975 <strong>and</strong> 2000.In other countries, the relative size of labour <strong>migration</strong> to the working age population is smaller,but nevertheless substantial: almost 10% in Jordan, 8.6% in Morocco <strong>and</strong> less than 5% in Syria, forinstance. Tunisia is a special case where the net <strong>migration</strong> balance was positive for the period 1990-2007 (i.e., more immigrants or returning emigrants than emigrants), although after a year-to-yearpositive balance between 1990 <strong>and</strong> 1999 (of between 3000 <strong>and</strong> 9000 net entrants a year, with a peak in1990 of 84,974 due to the first Gulf War), net outward <strong>migration</strong> has resumed, with a growingnegative net balance over the period reaching the 20,000 a year mark in 2006-2007 (a <strong>migration</strong> rate of23% of new entrants to the labour <strong>market</strong>) (see National Background Paper, Mahjoub 2009, p. 39).In any case, although statistics for <strong>flows</strong> are even more difficult to find than for <strong>migration</strong> stocks,there is evidence of increasing <strong>migration</strong> rates across AMCs. Taking the current <strong>migration</strong> rate of anaverage 8% as a minimum level of probable <strong>migration</strong>, the increase in the working age population ofAMCs will translate into a minimum yearly <strong>migration</strong> flow of 200,000 persons between 2010 <strong>and</strong>2020 (i.e., 2 million new AMC migrants over the period; see Figure 1.1.1). But there is strongevidence of increasing <strong>migration</strong> rates across AMCs in the last decade (23% in Tunisia, close to 100%in Lebanon), so that this flow could easily triple to 6 million new migrants over the next ten years if<strong>migration</strong> rates reach, for instance, a level of 24%, a level which is more consistent with recentevidence. The World Bank (2009a, p. 56) estimates a substantially higher level of <strong>migration</strong> fromAMCs, projecting it at 1.3 million migrants a year between 2010 <strong>and</strong> 2020 if current <strong>migration</strong> ratesare maintained.As for the educational profile of AMC migrant workers, the share of highly-educated migrantsamong all migrants is smaller for MENA migrants as a whole than for other migrants in OECDcountries. And the highly educated immigrants from MENA are concentrated in Anglo-Saxoncountries, where the share of MENA immigrants is relatively low. Adams (2006) shows evidence of aclear difference in the educational profile of Maghreb <strong>and</strong> Mashreq emigrants (to OECD countries):whereas most of Syrian, Lebanese <strong>and</strong> Jordan emigrants are highly-skilled (more than 13 years ofschooling), in the case of North African countries more than 70% of registered migrants are lowskilled (See Figure 4.2.1). Although this data is outdated, more recent evidence tends to confirm thispattern: as shown by Figure 6.3.1.1, skills levels of non EU-born workers in the EU in 2008 (both forrecent immigrants <strong>and</strong> for those with more than 7 years of residence) are the lowest of any of groupingof countries (with the exception of Turkey) for North Africa, whereas skill levels for Near <strong>and</strong> MiddleEastern migrant workers are well above average.Figure 4.2.1: Distribution of emigrants from theMENA to OECD by level of education (2000)Morocco70.616.512.9TunisiaSyriaLebanon3130.47324.725.112.1 14.944.344.5Low-skilled (less than8 years of schooling)Medium-skilled (9-12years of schooling)High-skilled (more than13 years of schooling)Jordan16.42855.60% 20% 40% 60% 80% 100%60
Chapter IFinal ReportSource: Adams (2006)If we take the extreme case of Morocco, around a third of Moroccan migrants in the EU do nothave any formal qualification, <strong>and</strong> another third only a primary education certificate. But there areimportant differences across countries of residence. The most critical situation is that of Spain <strong>and</strong>Italy, countries of recent Moroccan im<strong>migration</strong>. In Spain, around half the Moroccan immigrants haveno formal qualification; in Italy, this percentage is 43.6%. However, in the case of Morocco there isevidence of inter-generational progress among Maghreb immigrants in Europe (see NationalBackground Paper, Jaidi 2009, pp. 73-75).Reasons for MigrationEvidence from the region confirms the common sense intuition pointing to employment prospects asthe main driver of <strong>migration</strong>, although wages <strong>and</strong> living conditions tend to play a greater role thanunemployment as such. A field survey was carried out by the Egyptian Ministry of Manpower <strong>and</strong>E<strong>migration</strong> to determine the push factors in Egypt as identified by current <strong>and</strong> potential migrants. Theresults of this survey indicate that push factors in Egypt are overwhelmingly economic. Egyptianyouth regard <strong>migration</strong> – legal or illegal – as a possible way to escape poverty <strong>and</strong> unemployment.With respect to the reason for <strong>migration</strong>, the study indicates that the main reasons behind <strong>migration</strong>are the low wages <strong>and</strong> salaries in Egypt compared to Europe, bad living conditions <strong>and</strong> the lack of jobopportunities in Egypt, especially among new graduates. An important factor that plays a major role instimulating <strong>migration</strong> streams to Europe is the wealth of successful migrants <strong>and</strong> return migrants.Remittances of Egyptian migrants who work in <strong>European</strong> countries are important factors that stimulatea continuous stream of <strong>migration</strong>. Potential migrants claim that the “savings of one-year work inEurope is more than a lifetime salary in Egypt”. The current stream of Egyptian irregular <strong>migration</strong> toEurope started on the eve of the 21 st century with massive number of newly-graduated <strong>and</strong> poorlyeducatedunemployed youth engaged in irregular <strong>migration</strong> to Europe either across the MediterraneanSea via Libya or by over staying on tourist Schengen visas. Zohry (2008) argues that the main reasonsbehind this new type of <strong>migration</strong> are not related to the tightened policy adopted by the <strong>European</strong>Union, but instead to: (i) unemployment: the increasing severity of unemployment is one of the mainpush factors that stimulate a strong irregular <strong>migration</strong> stream to Europe; (ii) associated withunemployment is the difficulty for Egyptian youth to find employment opportunities in the Arab Gulfcountries due to the competition they face there from the cheap South East Asian labour now arrivingin massive numbers; <strong>and</strong> (iii) geographical proximity <strong>and</strong> the ease of travelling to Libya where most ofthe migrant boats to Europe set-off.Another survey carried out in Morocco shows that reasons stated for <strong>migration</strong> are predominantly(between 2/3 <strong>and</strong> 3/4) related to work <strong>and</strong> wages (National Background Paper, Jaidi 2009, pp. 79-81).In any case, the National Background Papers show that the main push factor for <strong>migration</strong> is notunemployment as such, but rather the large (<strong>and</strong> in most cases growing, see Section 2.3) wage <strong>and</strong>income differentials. So wage differentials, not unemployment as such, are the main drivers of<strong>migration</strong>. This seems to be confirmed by the fact that, in Lebanon, a significant majority of those whodeparted were people aged between 25 <strong>and</strong> 29 who were in employment when they made the decisionto leave the country.In Algeria, the survey carried out by Hammouda (2008) does not relate directly to this issue, butnonetheless gives us an insight into how young people represent <strong>migration</strong> <strong>and</strong> how they project theirfuture through it. It demonstrates that unemployment <strong>and</strong> the lack of employment prospects are not themain reason given by young people. The results suggest that the propensity to migrate depends, in thefirst place, on belonging to a <strong>migration</strong> basin (agglomeration effect), sex (men are more inclined tomigrate than women), instruction level (the more educated a person, the more he or she wishes tomigrate) <strong>and</strong> living conditions. For Hammouda, the high cost of <strong>migration</strong> explains why it attractsmainly graduate workers, <strong>and</strong> why the unemployed are excluded. However, the most original result of61
- Page 5 and 6:
STUDYLABOUR MARKETS PERFORMANCE AND
- Page 7 and 8:
Table of ContentsLABOUR MARKETS PER
- Page 10:
8.1 Actual migration and consumptio
- Page 15 and 16: Chapter IFinal Report 15 MILLION NE
- Page 17 and 18: Chapter IFinal Report …so that MI
- Page 19 and 20: Chapter IFinal Reportroots). The cu
- Page 21 and 22: Chapter IFinal Report In AMCs, REMI
- Page 23 and 24: Chapter IFinal Reportpolicies. This
- Page 25 and 26: Chapter IFinal ReportMediterranean
- Page 27 and 28: Chapter IFinal ReportMore recently,
- Page 29 and 30: Chapter IFinal Reportfor EU employm
- Page 31 and 32: Chapter IFinal Reportchosen, these
- Page 33 and 34: Chapter IFinal Reportexit of women
- Page 35 and 36: Chapter IFinal ReportFigure 1.2.1.
- Page 37 and 38: Chapter IFinal ReportA Declining Em
- Page 39 and 40: Chapter IFinal ReportThe same year,
- Page 41 and 42: Chapter IFinal ReportTable 2.2.1. I
- Page 43 and 44: Chapter IFinal Reportminimum wages
- Page 45 and 46: Chapter IFinal Report2.4 Unemployme
- Page 47 and 48: Chapter IFinal ReportYouth Unemploy
- Page 49 and 50: Chapter IFinal ReportBut one should
- Page 51 and 52: Chapter IFinal Reportmillion) 10 .
- Page 53 and 54: Chapter IFinal Reportmight intensif
- Page 55 and 56: Chapter IFinal Reporttrue labour ma
- Page 57 and 58: Chapter IFinal Reportto reform the
- Page 59 and 60: Chapter IFinal ReportFrom a differe
- Page 61: Chapter IFinal ReportTable 4.2.1 Ou
- Page 65 and 66: Chapter IFinal Reportin the destina
- Page 67 and 68: Chapter IFinal ReportIn conclusion,
- Page 69 and 70: Chapter IFinal Reportorganised in B
- Page 71 and 72: Chapter IFinal Reportsecond Intifad
- Page 73 and 74: Chapter IFinal Reportstands at 29.7
- Page 75 and 76: Chapter IFinal Reportconstruction w
- Page 77 and 78: Chapter IFinal ReportAs far as the
- Page 79 and 80: Chapter IFinal Reportother cases, l
- Page 81 and 82: Chapter IFinal Reportunemployment a
- Page 83 and 84: Chapter IFinal Reportof Egypt, so f
- Page 85 and 86: Chapter IFinal ReportWhile progress
- Page 87 and 88: Chapter IFinal ReportThese reservat
- Page 89 and 90: Chapter IFinal ReportAs Figure 6.3.
- Page 91 and 92: Chapter IFinal Reportin skill devel
- Page 93 and 94: Chapter IFinal ReportThe Directive
- Page 95 and 96: Chapter IFinal ReportThe need for
- Page 97 and 98: Chapter IFinal Reportobjectives are
- Page 99 and 100: Chapter IFinal Reporttrue Euro-Medi
- Page 101 and 102: Chapter IFinal Report- Putting empl
- Page 103 and 104: Chapter IFinal Report promotion of
- Page 105 and 106: Chapter IFinal ReportOtherADAMS, R.
- Page 107 and 108: Chapter IFinal ReportDE BEL-AIR, F.
- Page 109 and 110: Chapter IFinal ReportGUPTA, S., C.
- Page 111 and 112: Chapter IFinal ReportOECD (2000): M
- Page 113 and 114:
Chapter II - Thematic Background Pa
- Page 115 and 116:
Chapter IIThe impact of migration o
- Page 117 and 118:
Chapter IIThe impact of migration o
- Page 119 and 120:
Chapter IIThe impact of migration o
- Page 121 and 122:
Chapter IIThe impact of migration o
- Page 123 and 124:
Chapter IIThe impact of migration o
- Page 125 and 126:
Chapter IIThe impact of migration o
- Page 127 and 128:
Chapter IIThe impact of migration o
- Page 129 and 130:
Chapter IIThe impact of migration o
- Page 131 and 132:
Chapter IIThe impact of migration o
- Page 133 and 134:
Chapter IIThe impact of migration o
- Page 135 and 136:
Chapter IIThe impact of migration o
- Page 137 and 138:
Chapter IIThe impact of migration o
- Page 139 and 140:
Chapter IIThe impact of migration o
- Page 141 and 142:
Chapter IIThe impact of migration o
- Page 143 and 144:
Chapter IIThe impact of migration o
- Page 145 and 146:
Chapter IIThe impact of migration o
- Page 147 and 148:
Chapter IIThe impact of migration o
- Page 149 and 150:
Chapter IIThe impact of migration o
- Page 151 and 152:
Chapter IIThe impact of migration o
- Page 153 and 154:
Chapter IIThe impact of migration o
- Page 155 and 156:
Chapter IIThe impact of migration o
- Page 157 and 158:
Chapter IIThe impact of migration o
- Page 159 and 160:
Chapter IIThe impact of migration o
- Page 161 and 162:
Chapter III - Thematic Background P
- Page 163 and 164:
Chapter IIIEU Migration Policy towa
- Page 165 and 166:
Chapter IIIEU Migration Policy towa
- Page 167 and 168:
Chapter IIIEU Migration Policy towa
- Page 169 and 170:
Chapter IIIEU Migration Policy towa
- Page 171 and 172:
Chapter IIIEU Migration Policy towa
- Page 173 and 174:
Chapter IIIEU Migration Policy towa
- Page 175 and 176:
Chapter IIIEU Migration Policy towa
- Page 177 and 178:
Chapter IIIEU Migration Policy towa
- Page 179 and 180:
Chapter IIIEU Migration Policy towa
- Page 181 and 182:
Chapter IIIEU Migration Policy towa
- Page 183 and 184:
Chapter IIIEU Migration Policy towa
- Page 185 and 186:
Chapter IIIEU Migration Policy towa
- Page 187 and 188:
Chapter IIIEU Migration Policy towa
- Page 189 and 190:
Chapter IIIEU Migration Policy towa
- Page 191 and 192:
Chapter IIIEU Migration Policy towa
- Page 193 and 194:
Chapter IIIEU Migration Policy towa
- Page 195 and 196:
Chapter IIIEU Migration Policy towa
- Page 197 and 198:
Chapter IIIEU Migration Policy towa
- Page 199 and 200:
Chapter IIIEU Migration Policy towa
- Page 201 and 202:
Chapter IIIEU Migration Policy towa
- Page 203 and 204:
Chapter IIIEU Migration Policy towa
- Page 205 and 206:
Chapter IIIEU Migration Policy towa
- Page 207:
Chapter IIIEU Migration Policy towa