<strong>European</strong> CommissionOccasional Paper 60, Volume IBut this traditional view of <strong>migration</strong> as a net loss of human capital <strong>and</strong> skills has recently beenqualified by factoring in the positive incentives it creates for increasing education investment on thepart of families in the countries of origin <strong>and</strong> accounting for the net increase of skills this investmentbrings about. In AMCs, given that returns on education are comparatively low in the region,<strong>migration</strong>, under the right circumstances, could offer a means of increasing those returns. Stark et al.(1997) argue that “higher prospective returns to skills in a foreign country impinge on skill acquisitiondecisions at home”, <strong>and</strong> this positively influences the sending country as only a fraction of the wouldbemigrants who increased their private investments in education in response to the prospect tomigrate succeed in turning that prospect into reality. In our region, this is most obvious in Lebanon,but also in other AMCs.Still, some recent theoretical <strong>and</strong> empirical contributions have introduced relevant caveats againstthe endorsement of excessive optimism here. The expected income-schooling profile at destination,which drives the educational decision of would-be migrants, can be reduced by relevant distortionfactors. Immigrants tend to be overqualified for the job positions they take (Mattoo et al., 2008), <strong>and</strong>are overrepresented in manual occupations. Mattoo et al. (2008) includes Egypt in their analysis ofbrain waste in the US labour <strong>market</strong>; they show that workers from the MENA region have a higherprobability of obtaining a qualified job if they hold a professional degree; however the probability ofobtaining a qualified job with a master degree is only 49 per cent for an Egyptian migrant, comparedto 80 per cent for an Indian.This notwithst<strong>and</strong>ing, the static negative effect due to the drain of the “best <strong>and</strong> the brightest” isunlikely to be offset by a substantial positive dynamic contribution to human capital formation.Migration can also have a relevant influence on the endowment of specific kinds of labour, such ashealth-care workers or doctors <strong>and</strong> engineers. This is the most frequent concern regarding the possibleadverse effects of <strong>migration</strong> upon countries of origin (an argument often mentioned for Tunisia <strong>and</strong>Morocco, for instance in the National Background Papers).This need not represent an actual concern for the migrant-sending countries if the domesticeconomy is unable to productively employ skilled workers; then their <strong>migration</strong> would not represent aworrying brain drain, but it would rather be the consequence of a substantial mismatch between thehigher education system <strong>and</strong> the domestic labour <strong>market</strong>. The <strong>migration</strong> of skilled workers would thusalleviate the pressure on the labour <strong>market</strong> rather than represent a hindering factor for economicdevelopment. Indeed, in many AMCs the existence of large stocks of unemployed, underemployed or(in the case of women) inactive graduates would warrant the argument that those countries do not losepart of their human capital through <strong>migration</strong>, but rather valorise it <strong>and</strong> prevent its deterioration.Another important channel leading to loss of skilled workers or brain drain from developing countriesis through student <strong>migration</strong>. Many foreign students carry on living in the country where they moved toacquire higher education, <strong>and</strong> although the education costs fall on their families <strong>and</strong>/or the hostingcountries, the positive selection of these students entail a loss of human capital for the country of origin.In the case of AMCs, empirical evidence points to the need for a differentiated country-by-countryanalysis: in fact, some countries seem to suffer one kind or another of brain drain (in terms even ofshortage of qualified labour in certain sectors induced by <strong>migration</strong>), whereas others do not, or couldeven be experiencing a “brain gain” through the increased investment in education stimulated by theprospects of <strong>migration</strong> <strong>and</strong> the positive impact on skill availability among returning migrants. Wahba(2007) has demonstrated that <strong>migration</strong> ends up producing a certain degree of brain drain in Morocco,Tunisia <strong>and</strong> probably Lebanon, but not so in other countries of the region where there is a huge supplyof skilled labour.In percentage terms, Lebanon is the AMC where the loss of skilled workers is most evident: migrantsconstitute almost a third of Lebanon’s labour force, half of them skilled professionals. Data from the2001 USJ survey (the most recent available) shows that the e<strong>migration</strong> rate among the tertiary educated70
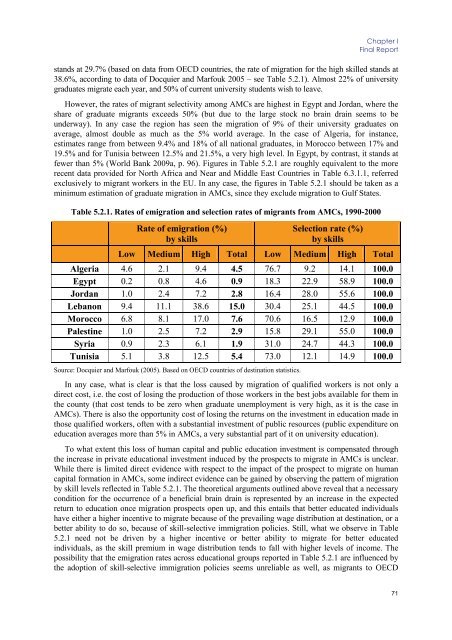
Chapter IFinal Reportst<strong>and</strong>s at 29.7% (based on data from OECD countries, the rate of <strong>migration</strong> for the high skilled st<strong>and</strong>s at38.6%, according to data of Docquier <strong>and</strong> Marfouk 2005 – see Table 5.2.1). Almost 22% of universitygraduates migrate each year, <strong>and</strong> 50% of current university students wish to leave.However, the rates of migrant selectivity among AMCs are highest in Egypt <strong>and</strong> Jordan, where theshare of graduate migrants exceeds 50% (but due to the large stock no brain drain seems to beunderway). In any case the region has seen the <strong>migration</strong> of 9% of their university graduates onaverage, almost double as much as the 5% world average. In the case of Algeria, for instance,estimates range from between 9.4% <strong>and</strong> 18% of all national graduates, in Morocco between 17% <strong>and</strong>19.5% <strong>and</strong> for Tunisia between 12.5% <strong>and</strong> 21.5%, a very high level. In Egypt, by contrast, it st<strong>and</strong>s atfewer than 5% (World Bank 2009a, p. 96). Figures in Table 5.2.1 are roughly equivalent to the morerecent data provided for North Africa <strong>and</strong> Near <strong>and</strong> Middle East Countries in Table 6.3.1.1, referredexclusively to migrant workers in the EU. In any case, the figures in Table 5.2.1 should be taken as aminimum estimation of graduate <strong>migration</strong> in AMCs, since they exclude <strong>migration</strong> to Gulf States.Table 5.2.1. Rates of e<strong>migration</strong> <strong>and</strong> selection rates of migrants from AMCs, 1990-2000Rate of e<strong>migration</strong> (%)by skillsSelection rate (%)by skillsLow Medium High Total Low Medium High TotalAlgeria 4.6 2.1 9.4 4.5 76.7 9.2 14.1 100.0Egypt 0.2 0.8 4.6 0.9 18.3 22.9 58.9 100.0Jordan 1.0 2.4 7.2 2.8 16.4 28.0 55.6 100.0Lebanon 9.4 11.1 38.6 15.0 30.4 25.1 44.5 100.0Morocco 6.8 8.1 17.0 7.6 70.6 16.5 12.9 100.0Palestine 1.0 2.5 7.2 2.9 15.8 29.1 55.0 100.0Syria 0.9 2.3 6.1 1.9 31.0 24.7 44.3 100.0Tunisia 5.1 3.8 12.5 5.4 73.0 12.1 14.9 100.0Source: Docquier <strong>and</strong> Marfouk (2005). Based on OECD countries of destination statistics.In any case, what is clear is that the loss caused by <strong>migration</strong> of qualified workers is not only adirect cost, i.e. the cost of losing the production of those workers in the best jobs available for them inthe county (that cost tends to be zero when graduate unemployment is very high, as it is the case inAMCs). There is also the opportunity cost of losing the returns on the investment in education made inthose qualified workers, often with a substantial investment of public resources (public expenditure oneducation averages more than 5% in AMCs, a very substantial part of it on university education).To what extent this loss of human capital <strong>and</strong> public education investment is compensated throughthe increase in private educational investment induced by the prospects to migrate in AMCs is unclear.While there is limited direct evidence with respect to the impact of the prospect to migrate on humancapital formation in AMCs, some indirect evidence can be gained by observing the pattern of <strong>migration</strong>by skill levels reflected in Table 5.2.1. The theoretical arguments outlined above reveal that a necessarycondition for the occurrence of a beneficial brain drain is represented by an increase in the expectedreturn to education once <strong>migration</strong> prospects open up, <strong>and</strong> this entails that better educated individualshave either a higher incentive to migrate because of the prevailing wage distribution at destination, or abetter ability to do so, because of skill-selective im<strong>migration</strong> policies. Still, what we observe in Table5.2.1 need not be driven by a higher incentive or better ability to migrate for better educatedindividuals, as the skill premium in wage distribution tends to fall with higher levels of income. Thepossibility that the e<strong>migration</strong> rates across educational groups reported in Table 5.2.1 are influenced bythe adoption of skill-selective im<strong>migration</strong> policies seems unreliable as well, as migrants to OECD71
- Page 5 and 6:
STUDYLABOUR MARKETS PERFORMANCE AND
- Page 7 and 8:
Table of ContentsLABOUR MARKETS PER
- Page 10:
8.1 Actual migration and consumptio
- Page 15 and 16:
Chapter IFinal Report 15 MILLION NE
- Page 17 and 18:
Chapter IFinal Report …so that MI
- Page 19 and 20:
Chapter IFinal Reportroots). The cu
- Page 21 and 22: Chapter IFinal Report In AMCs, REMI
- Page 23 and 24: Chapter IFinal Reportpolicies. This
- Page 25 and 26: Chapter IFinal ReportMediterranean
- Page 27 and 28: Chapter IFinal ReportMore recently,
- Page 29 and 30: Chapter IFinal Reportfor EU employm
- Page 31 and 32: Chapter IFinal Reportchosen, these
- Page 33 and 34: Chapter IFinal Reportexit of women
- Page 35 and 36: Chapter IFinal ReportFigure 1.2.1.
- Page 37 and 38: Chapter IFinal ReportA Declining Em
- Page 39 and 40: Chapter IFinal ReportThe same year,
- Page 41 and 42: Chapter IFinal ReportTable 2.2.1. I
- Page 43 and 44: Chapter IFinal Reportminimum wages
- Page 45 and 46: Chapter IFinal Report2.4 Unemployme
- Page 47 and 48: Chapter IFinal ReportYouth Unemploy
- Page 49 and 50: Chapter IFinal ReportBut one should
- Page 51 and 52: Chapter IFinal Reportmillion) 10 .
- Page 53 and 54: Chapter IFinal Reportmight intensif
- Page 55 and 56: Chapter IFinal Reporttrue labour ma
- Page 57 and 58: Chapter IFinal Reportto reform the
- Page 59 and 60: Chapter IFinal ReportFrom a differe
- Page 61 and 62: Chapter IFinal ReportTable 4.2.1 Ou
- Page 63 and 64: Chapter IFinal ReportSource: Adams
- Page 65 and 66: Chapter IFinal Reportin the destina
- Page 67 and 68: Chapter IFinal ReportIn conclusion,
- Page 69 and 70: Chapter IFinal Reportorganised in B
- Page 71: Chapter IFinal Reportsecond Intifad
- Page 75 and 76: Chapter IFinal Reportconstruction w
- Page 77 and 78: Chapter IFinal ReportAs far as the
- Page 79 and 80: Chapter IFinal Reportother cases, l
- Page 81 and 82: Chapter IFinal Reportunemployment a
- Page 83 and 84: Chapter IFinal Reportof Egypt, so f
- Page 85 and 86: Chapter IFinal ReportWhile progress
- Page 87 and 88: Chapter IFinal ReportThese reservat
- Page 89 and 90: Chapter IFinal ReportAs Figure 6.3.
- Page 91 and 92: Chapter IFinal Reportin skill devel
- Page 93 and 94: Chapter IFinal ReportThe Directive
- Page 95 and 96: Chapter IFinal ReportThe need for
- Page 97 and 98: Chapter IFinal Reportobjectives are
- Page 99 and 100: Chapter IFinal Reporttrue Euro-Medi
- Page 101 and 102: Chapter IFinal Report- Putting empl
- Page 103 and 104: Chapter IFinal Report promotion of
- Page 105 and 106: Chapter IFinal ReportOtherADAMS, R.
- Page 107 and 108: Chapter IFinal ReportDE BEL-AIR, F.
- Page 109 and 110: Chapter IFinal ReportGUPTA, S., C.
- Page 111 and 112: Chapter IFinal ReportOECD (2000): M
- Page 113 and 114: Chapter II - Thematic Background Pa
- Page 115 and 116: Chapter IIThe impact of migration o
- Page 117 and 118: Chapter IIThe impact of migration o
- Page 119 and 120: Chapter IIThe impact of migration o
- Page 121 and 122: Chapter IIThe impact of migration o
- Page 123 and 124:
Chapter IIThe impact of migration o
- Page 125 and 126:
Chapter IIThe impact of migration o
- Page 127 and 128:
Chapter IIThe impact of migration o
- Page 129 and 130:
Chapter IIThe impact of migration o
- Page 131 and 132:
Chapter IIThe impact of migration o
- Page 133 and 134:
Chapter IIThe impact of migration o
- Page 135 and 136:
Chapter IIThe impact of migration o
- Page 137 and 138:
Chapter IIThe impact of migration o
- Page 139 and 140:
Chapter IIThe impact of migration o
- Page 141 and 142:
Chapter IIThe impact of migration o
- Page 143 and 144:
Chapter IIThe impact of migration o
- Page 145 and 146:
Chapter IIThe impact of migration o
- Page 147 and 148:
Chapter IIThe impact of migration o
- Page 149 and 150:
Chapter IIThe impact of migration o
- Page 151 and 152:
Chapter IIThe impact of migration o
- Page 153 and 154:
Chapter IIThe impact of migration o
- Page 155 and 156:
Chapter IIThe impact of migration o
- Page 157 and 158:
Chapter IIThe impact of migration o
- Page 159 and 160:
Chapter IIThe impact of migration o
- Page 161 and 162:
Chapter III - Thematic Background P
- Page 163 and 164:
Chapter IIIEU Migration Policy towa
- Page 165 and 166:
Chapter IIIEU Migration Policy towa
- Page 167 and 168:
Chapter IIIEU Migration Policy towa
- Page 169 and 170:
Chapter IIIEU Migration Policy towa
- Page 171 and 172:
Chapter IIIEU Migration Policy towa
- Page 173 and 174:
Chapter IIIEU Migration Policy towa
- Page 175 and 176:
Chapter IIIEU Migration Policy towa
- Page 177 and 178:
Chapter IIIEU Migration Policy towa
- Page 179 and 180:
Chapter IIIEU Migration Policy towa
- Page 181 and 182:
Chapter IIIEU Migration Policy towa
- Page 183 and 184:
Chapter IIIEU Migration Policy towa
- Page 185 and 186:
Chapter IIIEU Migration Policy towa
- Page 187 and 188:
Chapter IIIEU Migration Policy towa
- Page 189 and 190:
Chapter IIIEU Migration Policy towa
- Page 191 and 192:
Chapter IIIEU Migration Policy towa
- Page 193 and 194:
Chapter IIIEU Migration Policy towa
- Page 195 and 196:
Chapter IIIEU Migration Policy towa
- Page 197 and 198:
Chapter IIIEU Migration Policy towa
- Page 199 and 200:
Chapter IIIEU Migration Policy towa
- Page 201 and 202:
Chapter IIIEU Migration Policy towa
- Page 203 and 204:
Chapter IIIEU Migration Policy towa
- Page 205 and 206:
Chapter IIIEU Migration Policy towa
- Page 207:
Chapter IIIEU Migration Policy towa