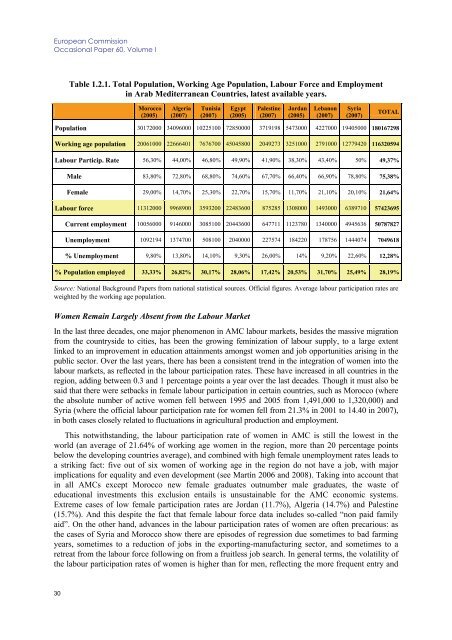
<strong>European</strong> CommissionOccasional Paper 60, Volume ITable 1.2.1. Total Population, Working Age Population, <strong>Labour</strong> Force <strong>and</strong> Employmentin Arab Mediterranean Countries, latest available years.Morocco(2005)Algeria(2007)Tunisia(2007)Egypt(2005)Palestine(2007)Jordan(2005)Lebanon(2007)Syria(2007)TOTALPopulation 30172000 34096000 10225100 72850000 3719198 5473000 4227000 19405000 180167298Working age population 20061000 22666401 7676700 45045800 2049273 3251000 2791000 12779420 116320594<strong>Labour</strong> Particip. Rate 56,30% 44,00% 46,80% 49,90% 41,90% 38,30% 43,40% 50% 49,37%Male 83,80% 72,80% 68,80% 74,60% 67,70% 66,40% 66,90% 78,80% 75,38%Female 29,00% 14,70% 25,30% 22,70% 15,70% 11,70% 21,10% 20,10% 21,64%<strong>Labour</strong> force 11312000 9968900 3593200 22483600 875285 1308000 1493000 6389710 57423695Current employment 10056000 9146000 3085100 20443600 647711 1123780 1340000 4945636 50787827Unemployment 1092194 1374700 508100 2040000 227574 184220 178756 1444074 7049618% Unemployment 9,80% 13,80% 14,10% 9,30% 26,00% 14% 9,20% 22,60% 12,28%% Population employed 33,33% 26,82% 30,17% 28,06% 17,42% 20,53% 31,70% 25,49% 28,19%Source: National Background Papers from national statistical sources. Official figures. Average labour participation rates areweighted by the working age population.Women Remain Largely Absent from the <strong>Labour</strong> MarketIn the last three decades, one major phenomenon in AMC labour <strong>market</strong>s, besides the massive <strong>migration</strong>from the countryside to cities, has been the growing feminization of labour supply, to a large extentlinked to an improvement in education attainments amongst women <strong>and</strong> job opportunities arising in thepublic sector. Over the last years, there has been a consistent trend in the integration of women into thelabour <strong>market</strong>s, as reflected in the labour participation rates. These have increased in all countries in theregion, adding between 0.3 <strong>and</strong> 1 percentage points a year over the last decades. Though it must also besaid that there were setbacks in female labour participation in certain countries, such as Morocco (wherethe absolute number of active women fell between 1995 <strong>and</strong> 2005 from 1,491,000 to 1,320,000) <strong>and</strong>Syria (where the official labour participation rate for women fell from 21.3% in 2001 to 14.40 in 2007),in both cases closely related to fluctuations in agricultural production <strong>and</strong> employment.This notwithst<strong>and</strong>ing, the labour participation rate of women in AMC is still the lowest in theworld (an average of 21.64% of working age women in the region, more than 20 percentage pointsbelow the developing countries average), <strong>and</strong> combined with high female unemployment rates leads toa striking fact: five out of six women of working age in the region do not have a job, with majorimplications for equality <strong>and</strong> even development (see Martín 2006 <strong>and</strong> 2008). Taking into account thatin all AMCs except Morocco new female graduates outnumber male graduates, the waste ofeducational investments this exclusion entails is unsustainable for the AMC economic systems.Extreme cases of low female participation rates are Jordan (11.7%), Algeria (14.7%) <strong>and</strong> Palestine(15.7%). And this despite the fact that female labour force data includes so-called “non paid familyaid”. On the other h<strong>and</strong>, advances in the labour participation rates of women are often precarious: asthe cases of Syria <strong>and</strong> Morocco show there are episodes of regression due sometimes to bad farmingyears, sometimes to a reduction of jobs in the exporting-manufacturing sector, <strong>and</strong> sometimes to aretreat from the labour force following on from a fruitless job search. In general terms, the volatility ofthe labour participation rates of women is higher than for men, reflecting the more frequent entry <strong>and</strong>30
Chapter IFinal Reportexit of women from the labour <strong>market</strong>, in particular in the urban context, which highlights the oftensubsidiary role of their work. In any case, women’s participation in the labour force is stronglycorrelated with education <strong>and</strong> urbanization.In the near future, the dynamics of the labour supply in AMCs will depend to a large extent on the paceof the increase in the labour participation of women.Low Qualification of the <strong>Labour</strong> ForceFree education, publicly provided, has been a central tenant of the social contract in most AMCs sinceindependence. Governments significantly exp<strong>and</strong>ed the education system, driven by rapidly exp<strong>and</strong>ingyoung populations <strong>and</strong> the need to build national identities. Formal education indicators have beenimproving rapidly with massive investment in education <strong>and</strong> training, in particular in terms of enrolmentrates. However, the focus on universal access to education has often overshadowed the issue of qualityresulting in some serious labour <strong>market</strong> imbalances caused by inadequate educational <strong>and</strong> trainingsystems, which do not respond to a changing dem<strong>and</strong> in skills.On average, only one in seven persons in the AMC labour force has a university degree (withPalestine, Egypt <strong>and</strong> Jordan having higher than average rates). Although there has been a wide accessto secondary education throughout the region (<strong>and</strong> in some cases, such as Egypt, to vocationaltraining), 44% of the AMC labour force still has no diploma or only a primary education diploma.Morocco <strong>and</strong> Syria are the countries with the lowest formal education profile (see Table 1.2.2), <strong>and</strong>the urban-rural education gap is still remarkable in all countries, with major implications for theprospects of productivity increase in the rural sector.The higher unemployment rates amongst educated workers makes the picture even more worryingwhen the qualification profile of employment instead of labour force is considered. This is clearlyshown in National Background Papers (Sections 1.2). Combined with the high concentration ofqualified workers in the public administration, this means that there is a significant number ofemployees in the industry, trade <strong>and</strong> communication sectors who have not even finished their primarylevel studies. This poses an enormous challenge in terms of productivity increase <strong>and</strong> competitivenessprospects for AMC economies.Table 1.2.2. Composition of AMC <strong>Labour</strong> Force by level of education (%, latest available year)Morocco(2007)Tunisia(2007)Egypt(2006)Palestine(2008)Jordan(2007)Lebanon(2004)Syria(2001)TOTAL<strong>Labour</strong> force 11148373 3593200 23624780 875285 1403600 1493000 6369000 48507238None 40,4% 11,6% 28,9% 14,0% 4,0% 10,0% 23,7% 28,0%Primary 40,9% 36,7% 14,2% 31,4% 44,3% 50,1% 53,5% 29,4%Secondary 10,2% 36,7% 33,0% 27,4% 26,7% 16,0% 14,9% 24,9%University 8,5% 15,0% 18,9% 27,2% 24,9% 20,1% 6,1% 14,9%Sources: National Background Papers from national statistical sources. Data for Algeria is not available. Please note that thefigures do not refer to the same years. Aggegation of levels of education to four main levels has been neccesary forcomparability purposes, but should not mislead about the diversity of the education systems across AMCs <strong>and</strong> the diversityof options available in each country for each level, in particular for secondary education (including vocational training, lower<strong>and</strong> higher secondary) <strong>and</strong> sometimes university (including post-secondary institute degrees, for instance in Egypt). The totalsum of percentages for Egypt, Lebanon <strong>and</strong> Syria do not add up to 100%. For Lebanon <strong>and</strong> Syria, labour force figures are thelatest available.31
- Page 5 and 6: STUDYLABOUR MARKETS PERFORMANCE AND
- Page 7 and 8: Table of ContentsLABOUR MARKETS PER
- Page 10: 8.1 Actual migration and consumptio
- Page 15 and 16: Chapter IFinal Report 15 MILLION NE
- Page 17 and 18: Chapter IFinal Report …so that MI
- Page 19 and 20: Chapter IFinal Reportroots). The cu
- Page 21 and 22: Chapter IFinal Report In AMCs, REMI
- Page 23 and 24: Chapter IFinal Reportpolicies. This
- Page 25 and 26: Chapter IFinal ReportMediterranean
- Page 27 and 28: Chapter IFinal ReportMore recently,
- Page 29 and 30: Chapter IFinal Reportfor EU employm
- Page 31: Chapter IFinal Reportchosen, these
- Page 35 and 36: Chapter IFinal ReportFigure 1.2.1.
- Page 37 and 38: Chapter IFinal ReportA Declining Em
- Page 39 and 40: Chapter IFinal ReportThe same year,
- Page 41 and 42: Chapter IFinal ReportTable 2.2.1. I
- Page 43 and 44: Chapter IFinal Reportminimum wages
- Page 45 and 46: Chapter IFinal Report2.4 Unemployme
- Page 47 and 48: Chapter IFinal ReportYouth Unemploy
- Page 49 and 50: Chapter IFinal ReportBut one should
- Page 51 and 52: Chapter IFinal Reportmillion) 10 .
- Page 53 and 54: Chapter IFinal Reportmight intensif
- Page 55 and 56: Chapter IFinal Reporttrue labour ma
- Page 57 and 58: Chapter IFinal Reportto reform the
- Page 59 and 60: Chapter IFinal ReportFrom a differe
- Page 61 and 62: Chapter IFinal ReportTable 4.2.1 Ou
- Page 63 and 64: Chapter IFinal ReportSource: Adams
- Page 65 and 66: Chapter IFinal Reportin the destina
- Page 67 and 68: Chapter IFinal ReportIn conclusion,
- Page 69 and 70: Chapter IFinal Reportorganised in B
- Page 71 and 72: Chapter IFinal Reportsecond Intifad
- Page 73 and 74: Chapter IFinal Reportstands at 29.7
- Page 75 and 76: Chapter IFinal Reportconstruction w
- Page 77 and 78: Chapter IFinal ReportAs far as the
- Page 79 and 80: Chapter IFinal Reportother cases, l
- Page 81 and 82: Chapter IFinal Reportunemployment a
- Page 83 and 84:
Chapter IFinal Reportof Egypt, so f
- Page 85 and 86:
Chapter IFinal ReportWhile progress
- Page 87 and 88:
Chapter IFinal ReportThese reservat
- Page 89 and 90:
Chapter IFinal ReportAs Figure 6.3.
- Page 91 and 92:
Chapter IFinal Reportin skill devel
- Page 93 and 94:
Chapter IFinal ReportThe Directive
- Page 95 and 96:
Chapter IFinal ReportThe need for
- Page 97 and 98:
Chapter IFinal Reportobjectives are
- Page 99 and 100:
Chapter IFinal Reporttrue Euro-Medi
- Page 101 and 102:
Chapter IFinal Report- Putting empl
- Page 103 and 104:
Chapter IFinal Report promotion of
- Page 105 and 106:
Chapter IFinal ReportOtherADAMS, R.
- Page 107 and 108:
Chapter IFinal ReportDE BEL-AIR, F.
- Page 109 and 110:
Chapter IFinal ReportGUPTA, S., C.
- Page 111 and 112:
Chapter IFinal ReportOECD (2000): M
- Page 113 and 114:
Chapter II - Thematic Background Pa
- Page 115 and 116:
Chapter IIThe impact of migration o
- Page 117 and 118:
Chapter IIThe impact of migration o
- Page 119 and 120:
Chapter IIThe impact of migration o
- Page 121 and 122:
Chapter IIThe impact of migration o
- Page 123 and 124:
Chapter IIThe impact of migration o
- Page 125 and 126:
Chapter IIThe impact of migration o
- Page 127 and 128:
Chapter IIThe impact of migration o
- Page 129 and 130:
Chapter IIThe impact of migration o
- Page 131 and 132:
Chapter IIThe impact of migration o
- Page 133 and 134:
Chapter IIThe impact of migration o
- Page 135 and 136:
Chapter IIThe impact of migration o
- Page 137 and 138:
Chapter IIThe impact of migration o
- Page 139 and 140:
Chapter IIThe impact of migration o
- Page 141 and 142:
Chapter IIThe impact of migration o
- Page 143 and 144:
Chapter IIThe impact of migration o
- Page 145 and 146:
Chapter IIThe impact of migration o
- Page 147 and 148:
Chapter IIThe impact of migration o
- Page 149 and 150:
Chapter IIThe impact of migration o
- Page 151 and 152:
Chapter IIThe impact of migration o
- Page 153 and 154:
Chapter IIThe impact of migration o
- Page 155 and 156:
Chapter IIThe impact of migration o
- Page 157 and 158:
Chapter IIThe impact of migration o
- Page 159 and 160:
Chapter IIThe impact of migration o
- Page 161 and 162:
Chapter III - Thematic Background P
- Page 163 and 164:
Chapter IIIEU Migration Policy towa
- Page 165 and 166:
Chapter IIIEU Migration Policy towa
- Page 167 and 168:
Chapter IIIEU Migration Policy towa
- Page 169 and 170:
Chapter IIIEU Migration Policy towa
- Page 171 and 172:
Chapter IIIEU Migration Policy towa
- Page 173 and 174:
Chapter IIIEU Migration Policy towa
- Page 175 and 176:
Chapter IIIEU Migration Policy towa
- Page 177 and 178:
Chapter IIIEU Migration Policy towa
- Page 179 and 180:
Chapter IIIEU Migration Policy towa
- Page 181 and 182:
Chapter IIIEU Migration Policy towa
- Page 183 and 184:
Chapter IIIEU Migration Policy towa
- Page 185 and 186:
Chapter IIIEU Migration Policy towa
- Page 187 and 188:
Chapter IIIEU Migration Policy towa
- Page 189 and 190:
Chapter IIIEU Migration Policy towa
- Page 191 and 192:
Chapter IIIEU Migration Policy towa
- Page 193 and 194:
Chapter IIIEU Migration Policy towa
- Page 195 and 196:
Chapter IIIEU Migration Policy towa
- Page 197 and 198:
Chapter IIIEU Migration Policy towa
- Page 199 and 200:
Chapter IIIEU Migration Policy towa
- Page 201 and 202:
Chapter IIIEU Migration Policy towa
- Page 203 and 204:
Chapter IIIEU Migration Policy towa
- Page 205 and 206:
Chapter IIIEU Migration Policy towa
- Page 207:
Chapter IIIEU Migration Policy towa