

Online proceedings - EDA Publishing Association
Online proceedings - EDA Publishing Association
Online proceedings - EDA Publishing Association
- No tags were found...

Create successful ePaper yourself
Turn your PDF publications into a flip-book with our unique Google optimized e-Paper software.
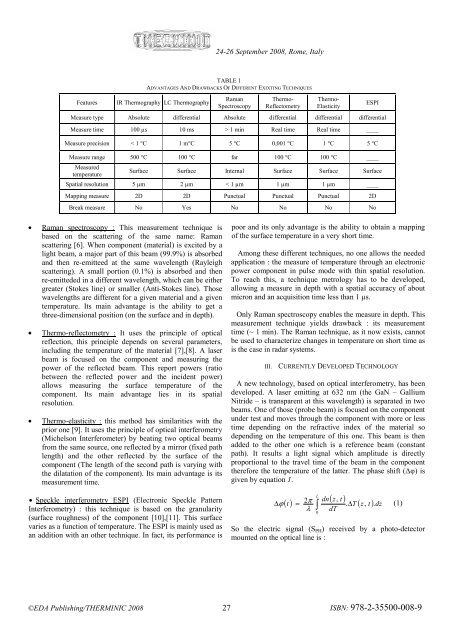
24-26 September 2008, Rome, ItalyFeaturesTABLE 1ADVANTAGES AND DRAWBACKS OF DIFFERENT EXIXTING TECHNIQUESIR Thermography LC ThermographyRamanSpectroscopyThermo-ReflectometryThermo-ElasticityMeasure type Absolute differential Absolute differential differential differentialMeasure time 100 µs 10 ms > 1 min Real time Real time ____Measure precision < 1 °C 1 m°C 5 °C 0,001 °C 1 °C 5 °CMeasure range 500 °C 100 °C far 100 °C 100 °C ____MeasuredtemperatureESPISurface Surface Internal Surface Surface SurfaceSpatial resolution 5 µm 2 µm < 1 µm 1 µm 1 µm ____Mapping measure 2D 2D Punctual Punctual Punctual 2DBreak measure No Yes No No No No• Raman spectroscopy : This measurement technique isbased on the scattering of the same name: Ramanscattering [6]. When component (material) is excited by alight beam, a major part of this beam (99.9%) is absorbedand then re-emitteed at the same wavelength (Rayleighscattering). A small portion (0.1%) is absorbed and thenre-emitteded in a different wavelength, which can be eithergreater (Stokes line) or smaller (Anti-Stokes line). Thosewavelengths are different for a given material and a giventemperature. Its main advantage is the ability to get athree-dimensional position (on the surface and in depth).• Thermo-reflectometry : It uses the principle of opticalreflection, this principle depends on several parameters,including the temperature of the material [7],[8]. A laserbeam is focused on the component and measuring thepower of the reflected beam. This report powers (ratiobetween the reflected power and the incident power)allows measuring the surface temperature of thecomponent. Its main advantage lies in its spatialresolution.• Thermo-elasticity : this method has similarities with theprior one [9]. It uses the principle of optical interferometry(Michelson Interferometer) by beating two optical beamsfrom the same source, one reflected by a mirror (fixed pathlength) and the other reflected by the surface of thecomponent (The length of the second path is varying withthe dilatation of the component). Its main advantage is itsmeasurement time.• Speckle interferometry ESPI (Electronic Speckle PatternInterferometry) : this technique is based on the granularity(surface roughness) of the component [10],[11]. This surfacevaries as a function of temperature. The ESPI is mainly used asan addition with an other technique. In fact, its performance ispoor and its only advantage is the ability to obtain a mappingof the surface temperature in a very short time.Among these different techniques, no one allows the neededapplication : the measure of temperature through an electronicpower component in pulse mode with thin spatial resolution.To reach this, a technique metrology has to be developed,allowing a measure in depth with a spatial accuracy of aboutmicron and an acquisition time less than 1 µs.Only Raman spectroscopy enables the measure in depth. Thismeasurement technique yields drawback : its measurementtime (~ 1 min). The Raman technique, as it now exists, cannotbe used to characterize changes in temperature on short time asis the case in radar systems.III. CURRENTLY DEVELOPED TECHNOLOGYA new technology, based on optical interferometry, has beendeveloped. A laser emitting at 632 nm (the GaN – GalliumNitride – is transparent at this wavelength) is separated in twobeams. One of those (probe beam) is focused on the componentunder test and moves through the component with more or lesstime depending on the refractive index of the material sodepending on the temperature of this one. This beam is thenadded to the other one which is a reference beam (constantpath). It results a light signal which amplitude is directlyproportional to the travel time of the beam in the componenttherefore the temperature of the latter. The phase shift (Δφ) isgiven by equation 1.Δϕ() t=2πλL∫0( z,t )dndT. ΔT( z,t )dz .So the electric signal (S PH ) received by a photo-detectormounted on the optical line is :(1)©<strong>EDA</strong> <strong>Publishing</strong>/THERMINIC 2008 27ISBN: 978-2-35500-008-9


