- Page 1 and 2:
A REPORT ONAboriginalCo-operativesi
- Page 3 and 4:
Copyright © 2001 Centre for the St
- Page 5 and 6:
A B O R I G I N A L C O - O P E R A
- Page 7 and 8:
A B O R I G I N A L C O - O P E R A
- Page 10 and 11:
Table of ContentsExecutive Summary
- Page 12 and 13:
F O R E W O R DThe Nature of This S
- Page 14 and 15:
~ F O R E W O R DCo-operatives are
- Page 16 and 17:
C H A P T E RO N EThe Current State
- Page 18 and 19:
~ T H E C U R R E N T S T A T EGove
- Page 20 and 21:
~ T H E C U R R E N T S T A T EFirs
- Page 22 and 23:
~ T H E C U R R E N T S T A T ESelf
- Page 24 and 25:
~ T H E C U R R E N T S T A T EUnde
- Page 26 and 27:
~ T H E C U R R E N T S T A T EThir
- Page 28 and 29:
~ T H E C U R R E N T S T A T Eretu
- Page 30 and 31:
~ T H E C U R R E N T S T A T Ehave
- Page 32 and 33:
~ T H E C U R R E N T S T A T Epatt
- Page 34 and 35:
~ T H E C U R R E N T S T A T EOngo
- Page 36 and 37:
~ T H E C U R R E N T S T A T Epote
- Page 38 and 39:
~ E M E R G I N G T H E M E SThe ne
- Page 40 and 41:
~ E M E R G I N G T H E M E SEmergi
- Page 42 and 43:
~ E M E R G I N G T H E M E Sl’Ou
- Page 44 and 45:
~ E M E R G I N G T H E M E SConclu
- Page 46 and 47:
~ E M E R G I N G T H E M E SAkochi
- Page 48 and 49: ~ E M E R G I N G T H E M E SManage
- Page 50 and 51: ~ E M E R G I N G T H E M E SConclu
- Page 52 and 53: ~ T H E P O T E N T I A L F O R G R
- Page 54 and 55: ~ T H E P O T E N T I A L F O R G R
- Page 56 and 57: ~ T H E P O T E N T I A L F O R G R
- Page 58 and 59: ~ T H E P O T E N T I A L F O R G R
- Page 60 and 61: ~ T H E P O T E N T I A L F O R G R
- Page 62 and 63: APPENDIX APART 1Socio-Economic Prof
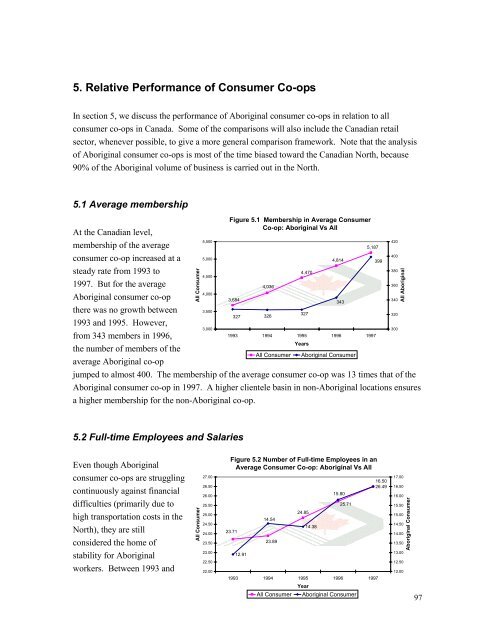
- Page 64 and 65: 5. Relative performance of consumer
- Page 66 and 67: Every year, the Co-operatives Secre
- Page 68 and 69: 1. Formation of Aboriginal Co-ops a
- Page 70 and 71: is even more striking when we look
- Page 72 and 73: The dichotomous structure ofactivit
- Page 74 and 75: 2.2 Sectoraldistribution ofAborigin
- Page 76 and 77: in sectors that are more labor inte
- Page 78 and 79: 77Table 2.3 ACTIVITIES OF A SAMPLE
- Page 80 and 81: 3. Organization of Aboriginal co-op
- Page 82 and 83: The selling of Inuit art by individ
- Page 84 and 85: caisses populaires Desjardins. The
- Page 86 and 87: Both the Federal and Provincial Gov
- Page 88 and 89: 4.2 Sales GrowthIn this section, we
- Page 90 and 91: products (basically food and hardwa
- Page 92 and 93: in employment between 1993 and 1997
- Page 94 and 95: health of co-ops in general. Unlike
- Page 96 and 97: “overcapitalization” by Aborigi
- Page 100 and 101: 5.3 Consumer Products and Food Sale
- Page 102 and 103: The “Aboriginal” member spends
- Page 104 and 105: to other consumer co-ops.It was als
- Page 106 and 107: Aboriginal) are more liquid than th
- Page 108 and 109: 6.2 EmploymentFigure 6.2 shows the
- Page 110 and 111: Aboriginal workers could receive el
- Page 112 and 113: of two major components: property (
- Page 114 and 115: In short, Inuit co-ops are an impor
- Page 116 and 117: 115Table 6.3 Selected Statistics of
- Page 118 and 119: some analysis that we felt was impo
- Page 120 and 121: Aboriginal co-ops remain active in
- Page 122 and 123: Indian Affairs and Northern Develop
- Page 124 and 125: HIGHLIGHTS• Population, including
- Page 126 and 127: PopulationFigure A.1 Population in
- Page 128 and 129: Table A.1 Public School Enrollments
- Page 130 and 131: Table A.4 Aboriginal Employment Rat
- Page 132 and 133: were 13.7% and 20.7% respectively,
- Page 134 and 135: Consumer Price Index (CPI)Figure A.
- Page 136 and 137: D. Finance and InvestmentThis secti
- Page 138 and 139: BibliographyCensus Dictionary, Fina
- Page 140 and 141: FIGURE B1 A MAP OF CANADIAN ABORIGI
- Page 142 and 143: ~ P E R S P E C T I V E S O F R E G
- Page 144 and 145: ~ P E R S P E C T I V E S O F R E G
- Page 146 and 147: ~ P E R S P E C T I V E S O F R E G
- Page 148 and 149:
~ P E R S P E C T I V E S O F R E G
- Page 150 and 151:
~ P E R S P E C T I V E S O F R E G
- Page 152 and 153:
~ P E R S P E C T I V E S O F R E G
- Page 154 and 155:
~ P E R S P E C T I V E S O F R E G
- Page 156 and 157:
~ P E R S P E C T I V E S O F R E G
- Page 158 and 159:
2.0 INCREASING SELF-RELIANCE2.1 LAN
- Page 160 and 161:
CANADA MORTGAGE AND HOUSING CORPORA
- Page 162 and 163:
3.0 SUPPORTIVE BUSINESS ENVIRONMENT
- Page 164 and 165:
2.0 INCREASING SELF-RELIANCE2.1 LAN
- Page 166 and 167:
INDIAN AND NORTHERN AFFAIRS CANADA1
- Page 168 and 169:
1.4 INNOVATION (FINANCIAL AND NON-F
- Page 170 and 171:
2.2 WORKFORCE TRAINING AND EXPERIEN
- Page 172 and 173:
3.2 CONNECTEDNESS INITIATIVESProgra
- Page 174 and 175:
2.0 INCREASING SELF-RELIANCE2.1 LAN
- Page 176 and 177:
2.3 SOCIAL ASSISTANCE REFORMProgram
- Page 178 and 179:
Part 3: Provincial/Territorial Init
- Page 180 and 181:
~ P R O V I N C I A L / T E R R I T
- Page 182 and 183:
~ P R O V I N C I A L / T E R R I T
- Page 184 and 185:
~ P R O V I N C I A L / T E R R I T
- Page 186 and 187:
~ P R O V I N C I A L / T E R R I T
- Page 188 and 189:
~ P R O V I N C I A L / T E R R I T
- Page 190 and 191:
~ P R O V I N C I A L / T E R R I T
- Page 192 and 193:
~ P R O V I N C I A L / T E R R I T
- Page 194 and 195:
~ P R O V I N C I A L / T E R R I T
- Page 196 and 197:
~ P R O V I N C I A L / T E R R I T
- Page 198 and 199:
~ P R O V I N C I A L / T E R R I T
- Page 200 and 201:
~ P R O V I N C I A L / T E R R I T
- Page 202 and 203:
~ P R O V I N C I A L / T E R R I T
- Page 204 and 205:
~ P R O V I N C I A L / T E R R I T
- Page 206 and 207:
~ P R O V I N C I A L / T E R R I T
- Page 208 and 209:
~ P R O V I N C I A L / T E R R I T
- Page 210 and 211:
~ P R O V I N C I A L / T E R R I T
- Page 212 and 213:
~ P R O V I N C I A L / T E R R I T
- Page 214 and 215:
~ P R O V I N C I A L / T E R R I T
- Page 216 and 217:
~ P R O V I N C I A L / T E R R I T
- Page 218 and 219:
A P P E N D I XCCo-operatives in Qu
- Page 220 and 221:
~ C O - O P S I N Q U É B E C A B
- Page 222 and 223:
~ C O - O P S I N Q U É B E C A B
- Page 224 and 225:
~ C O - O P S I N Q U É B E C A B
- Page 226 and 227:
~ C O - O P S I N Q U É B E C A B
- Page 228 and 229:
~ C O - O P S I N Q U É B E C A B
- Page 230 and 231:
~ C O - O P S I N Q U É B E C A B
- Page 232 and 233:
Bibliography[Quotes in the body of
- Page 234 and 235:
~ C O - O P S I N Q U É B E C A B
- Page 236 and 237:
~ C O - O P E R A T I V E S A N D C
- Page 238 and 239:
~ C O - O P E R A T I V E S A N D C
- Page 240 and 241:
~ C O - O P E R A T I V E S A N D C
- Page 242 and 243:
~ C O - O P E R A T I V E S A N D C
- Page 244 and 245:
~ C O - O P E R A T I V E S A N D C
- Page 246 and 247:
~ C O - O P E R A T I V E S A N D C
- Page 248 and 249:
~ C O - O P E R A T I V E S A N D C
- Page 250 and 251:
~ C O - O P E R A T I V E S A N D C
- Page 252 and 253:
~ C O - O P E R A T I V E S A N D C
- Page 254 and 255:
~ C O - O P E R A T I V E S A N D C
- Page 256 and 257:
~ C O - O P E R A T I V E S A N D C
- Page 258 and 259:
~ C O - O P E R A T I V E S A N D C
- Page 260 and 261:
~ C O - O P E R A T I V E S A N D C
- Page 262 and 263:
~ C O - O P E R A T I V E S A N D C
- Page 264 and 265:
~ S T A T E M E N T O N T H E C O -
- Page 266 and 267:
~ M E T H O D O L O G Y2. In-Person
- Page 268 and 269:
~ M E T H O D O L O G Yissues; area
- Page 270 and 271:
A P P E N D I XHCase Study Guidelin
- Page 272 and 273:
~ C A S E S T U D I E SA P P E N D
- Page 274 and 275:
~ C A S E S T U D I E Sthe main foc
- Page 276 and 277:
~ C A S E S T U D I E Sthey sold, t
- Page 278 and 279:
~ C A S E S T U D I E Sboth in Sask
- Page 280 and 281:
~ C A S E S T U D I E Sestimate the
- Page 282 and 283:
~ C A S E S T U D I E SThey are les
- Page 284 and 285:
A P P E N D I X I ~have been diffic
- Page 286 and 287:
A P P E N D I X I ~arts and crafts.
- Page 288 and 289:
A P P E N D I X I ~286 ~
- Page 290 and 291:
A P P E N D I X I ~288 ~
- Page 292 and 293:
~ C A S E S T U D I E SIkaluktutiak
- Page 294 and 295:
A P P E N D I X I ~In order to meet
- Page 296 and 297:
A P P E N D I X I ~and recently dra
- Page 298 and 299:
A P P E N D I X I ~The bakery was s
- Page 300 and 301:
A P P E N D I X I ~Bill describes h
- Page 302 and 303:
A P P E N D I X I ~Reasons for Succ
- Page 304 and 305:
A P P E N D I X I ~Bill states, “
- Page 306 and 307:
A P P E N D I X I ~The future looks
- Page 308 and 309:
A P P E N D I X I ~communities in C
- Page 310 and 311:
A P P E N D I X I ~third parties wh
- Page 312 and 313:
A P P E N D I X I ~measure of confi
- Page 314 and 315:
A P P E N D I X I ~BibliographyPape
- Page 316 and 317:
A P P E N D I X I ~number of areas,
- Page 318 and 319:
A P P E N D I X I ~although the org
- Page 320 and 321:
A P P E N D I X I ~BibliographyPape
- Page 322 and 323:
A P P E N D I X I ~Apaqtukewaq Fish
- Page 324 and 325:
A P P E N D I X I ~ManagementIn the
- Page 326 and 327:
A P P E N D I X I ~Anishinabek Nati
- Page 328 and 329:
A P P E N D I X I ~termed Aborigina
- Page 330 and 331:
A P P E N D I X I ~Profitable Proje
- Page 332 and 333:
A P P E N D I X I ~ANCU will only b
- Page 334 and 335:
A P P E N D I X I ~3. Funding is se
- Page 336 and 337:
A P P E N D I X I ~knowledgeable ab
- Page 338 and 339:
A P P E N D I X I ~Native Inter-Tri
- Page 340 and 341:
A P P E N D I X I ~are both working
- Page 342 and 343:
A P P E N D I X I ~local school and
- Page 344 and 345:
A P P E N D I X I ~We found that th
- Page 346 and 347:
A P P E N D I X I ~In return for th
- Page 348 and 349:
A P P E N D I X I ~When they do hav
- Page 350 and 351:
A P P E N D I X I ~The two NITH int
- Page 352 and 353:
A P P E N D I X I ~for anyone to us
- Page 354 and 355:
A P P E N D I X I ~youth of the com
- Page 356 and 357:
A P P E N D I X I ~Community Involv
- Page 358 and 359:
A P P E N D I X I ~Advice to Others
- Page 360 and 361:
A P P E N D I X I ~Neechi Foods Co-
- Page 362 and 363:
A P P E N D I X I ~Community Impact
- Page 364 and 365:
A P P E N D I X I ~few years as a r
- Page 366 and 367:
A P P E N D I X I ~The worker co-op
- Page 368 and 369:
A P P E N D I X I ~Since the start
- Page 370 and 371:
A P P E N D I X I ~to urban Native
- Page 372 and 373:
A P P E N D I X I ~December because
- Page 374 and 375:
A P P E N D I X I ~Social Attitudes
- Page 376 and 377:
A P P E N D I X I ~years ago. The o
- Page 378 and 379:
A P P E N D I X I ~sources can be m
- Page 380 and 381:
A P P E N D I X I ~Wilp Sa Maa’y
- Page 382 and 383:
A P P E N D I X I ~opened an accoun
- Page 384 and 385:
A P P E N D I X I ~grow on the coas
- Page 386 and 387:
A P P E N D I X I ~We also need to
- Page 388 and 389:
A P P E N D I X I ~• We gave pres
- Page 390 and 391:
A P P E N D I X I ~its direction. (
- Page 392 and 393:
A P P E N D I XJAdditional Case Stu
- Page 394 and 395:
A P P E N D I X J : A D D I T I O N
- Page 396 and 397:
A P P E N D I X J : A D D I T I O N
- Page 398 and 399:
A P P E N D I X J : A D D I T I O N
- Page 400 and 401:
A P P E N D I X J : A D D I T I O N
- Page 402:
A P P E N D I X K : T H E C O N S U