- Page 1 and 2:
Lecture Notes in Computer Science 4
- Page 3 and 4:
Volume Editors Per Stenström Chalm
- Page 5 and 6:
VI Preface The planning of a confer
- Page 7 and 8:
VIII Organization Mahmut Kandemir P
- Page 9 and 10:
Invited Program Table of Contents S
- Page 11:
Table of Contents XIII Turbo-ROB: A
- Page 14 and 15:
4 M. Valero and J. Labarta future s
- Page 17 and 18:
MIPS MT: A Multithreaded RISC Archi
- Page 19 and 20:
2.2 VPEs as Scheduling Domains MIPS
- Page 21 and 22:
MIPS MT: A Multithreaded RISC Archi
- Page 23 and 24:
6.1 Thread Context Virtualization M
- Page 25 and 26:
8 Experimental Results MIPS MT: A M
- Page 27 and 28:
Cycles/ Iteration MIPS MT: A Multit
- Page 29:
9 Conclusions MIPS MT: A Multithrea
- Page 32 and 33:
MPI: Message Passing on Multicore P
- Page 34 and 35:
MPI: Message Passing on Multicore P
- Page 36 and 37:
MPI: Message Passing on Multicore P
- Page 38 and 39:
overhead per word (cycles) 1200 100
- Page 40 and 41:
speedup 3.5 3 2.5 2 1.5 1 0.5 0 rMP
- Page 42 and 43:
speedup 9 8 7 6 5 4 3 2 1 0 rMPI: M
- Page 44 and 45:
MPI: Message Passing on Multicore P
- Page 46 and 47:
MPI: Message Passing on Multicore P
- Page 48 and 49:
Modeling Multigrain Parallelism on
- Page 50 and 51:
Modeling Multigrain Parallelism on
- Page 52 and 53:
Modeling Multigrain Parallelism on
- Page 54 and 55:
Modeling Multigrain Parallelism on
- Page 56 and 57:
Modeling Multigrain Parallelism on
- Page 58 and 59:
Modeling Multigrain Parallelism on
- Page 60 and 61:
Modeling Multigrain Parallelism on
- Page 63 and 64:
BRAM-LUT Tradeoff on a Polymorphic
- Page 65 and 66:
32 L0 L1 BRAM-LUT Tradeoff on a Pol
- Page 67 and 68:
BRAM-LUT Tradeoff on a Polymorphic
- Page 69 and 70:
BRAM-LUT Tradeoff on a Polymorphic
- Page 71 and 72:
BRAM-LUT Tradeoff on a Polymorphic
- Page 73:
BRAM-LUT Tradeoff on a Polymorphic
- Page 76 and 77:
Architecture Enhancements for the A
- Page 78 and 79:
Architecture Enhancements for the A
- Page 80 and 81:
Architecture Enhancements for the A
- Page 82 and 83:
Architecture Enhancements for the A
- Page 84 and 85:
Architecture Enhancements for the A
- Page 86 and 87:
Architecture Enhancements for the A
- Page 88 and 89:
Architecture Enhancements for the A
- Page 90 and 91:
Architecture Enhancements for the A
- Page 92 and 93:
Implementation of an UWB Impulse-Ra
- Page 94 and 95:
Implementation of an UWB Impulse-Ra
- Page 96 and 97:
Implementation of an UWB Impulse-Ra
- Page 98 and 99:
Implementation of an UWB Impulse-Ra
- Page 100 and 101:
Implementation of an UWB Impulse-Ra
- Page 102 and 103:
Implementation of an UWB Impulse-Ra
- Page 104 and 105:
Implementation of an UWB Impulse-Ra
- Page 107 and 108:
Fast Bounds Checking Using Debug Re
- Page 109 and 110:
Fast Bounds Checking Using Debug Re
- Page 111 and 112:
Fast Bounds Checking Using Debug Re
- Page 113 and 114:
Fast Bounds Checking Using Debug Re
- Page 115 and 116:
Fast Bounds Checking Using Debug Re
- Page 117 and 118:
Fast Bounds Checking Using Debug Re
- Page 119 and 120:
Fast Bounds Checking Using Debug Re
- Page 121:
Fast Bounds Checking Using Debug Re
- Page 124 and 125:
Studying Compiler Optimizations on
- Page 126 and 127:
Studying Compiler Optimizations on
- Page 128 and 129:
Studying Compiler Optimizations on
- Page 130 and 131:
avg normalized execution time 1.000
- Page 132 and 133:
Studying Compiler Optimizations on
- Page 134 and 135:
Studying Compiler Optimizations on
- Page 136 and 137:
Studying Compiler Optimizations on
- Page 138 and 139:
Studying Compiler Optimizations on
- Page 140 and 141:
CLI as an Effective Deployment Form
- Page 142 and 143:
CLI as an Effective Deployment Form
- Page 144 and 145:
CLI as an Effective Deployment Form
- Page 146 and 147:
CLI as an Effective Deployment Form
- Page 148 and 149:
CLI as an Effective Deployment Form
- Page 150 and 151:
CLI as an Effective Deployment Form
- Page 152 and 153:
CLI as an Effective Deployment Form
- Page 155 and 156:
Compilation Strategies for Reducing
- Page 157 and 158:
Compilation Strategies for Reducing
- Page 159 and 160:
Compilation Strategies for Reducing
- Page 161 and 162:
Compilation Strategies for Reducing
- Page 163 and 164:
Compilation Strategies for Reducing
- Page 165 and 166:
Compilation Strategies for Reducing
- Page 167 and 168:
180% 160% 140% 120% 100% 80% 60% 40
- Page 169 and 170:
Experiences with Parallelizing a Bi
- Page 171 and 172:
Experiences with Parallelizing a Bi
- Page 173 and 174:
Experiences with Parallelizing a Bi
- Page 175 and 176:
Experiences with Parallelizing a Bi
- Page 177 and 178:
Experiences with Parallelizing a Bi
- Page 179 and 180:
Experiences with Parallelizing a Bi
- Page 181 and 182:
Experiences with Parallelizing a Bi
- Page 183:
Experiences with Parallelizing a Bi
- Page 186 and 187:
Drug Design Issues on the Cell BE 1
- Page 188 and 189:
Drug Design Issues on the Cell BE 1
- Page 190 and 191:
Drug Design Issues on the Cell BE 1
- Page 192 and 193:
Drug Design Issues on the Cell BE 1
- Page 194 and 195:
speed-up 8 6 4 2 0 FFT3D 256 64-A F
- Page 196 and 197:
Drug Design Issues on the Cell BE 1
- Page 198 and 199:
Drug Design Issues on the Cell BE 1
- Page 201 and 202:
COFFEE: COmpiler Framework for Ener
- Page 203 and 204:
COFFEE: COmpiler Framework for Ener
- Page 205 and 206:
Benchmark Source Code * transformed
- Page 207 and 208:
COFFEE: COmpiler Framework for Ener
- Page 209 and 210:
RTL for each Component * Gate−lev
- Page 211 and 212:
COFFEE: COmpiler Framework for Ener
- Page 213 and 214:
Normalized Cycle Count 1.00 0.90 0.
- Page 215 and 216:
COFFEE: COmpiler Framework for Ener
- Page 217 and 218:
Integrated CPU Cache Power Manageme
- Page 219 and 220:
Integrated CPU Cache Power Manageme
- Page 221 and 222:
Integrated CPU Cache Power Manageme
- Page 223 and 224:
Integrated CPU Cache Power Manageme
- Page 225 and 226:
Integrated CPU Cache Power Manageme
- Page 227 and 228:
Integrated CPU Cache Power Manageme
- Page 229 and 230:
Integrated CPU Cache Power Manageme
- Page 231:
Integrated CPU Cache Power Manageme
- Page 234 and 235:
Variation-Aware Software Techniques
- Page 236 and 237:
Variation-Aware Software Techniques
- Page 238 and 239:
Variation-Aware Software Techniques
- Page 240 and 241:
Variation-Aware Software Techniques
- Page 242 and 243:
Variation-Aware Software Techniques
- Page 244 and 245:
Average leakage-power saving (%) Va
- Page 246 and 247:
Variation-Aware Software Techniques
- Page 248 and 249:
Variation-Aware Software Techniques
- Page 250 and 251:
244 Y. Sazeides et al. of mispredic
- Page 252 and 253:
246 Y. Sazeides et al. Affector BB1
- Page 254 and 255:
248 Y. Sazeides et al. 2.3 How to U
- Page 256 and 257:
250 Y. Sazeides et al. Cumulative D
- Page 258 and 259:
252 Y. Sazeides et al. ijpeg, andbo
- Page 260 and 261:
254 Y. Sazeides et al. Misses/KI 12
- Page 262 and 263:
256 Y. Sazeides et al. Mahlke and N
- Page 265 and 266:
Turbo-ROB: A Low Cost Checkpoint/Re
- Page 267 and 268:
260 P. Akl and A. Moshovos Original
- Page 269 and 270:
262 P. Akl and A. Moshovos Oldest I
- Page 271 and 272:
264 P. Akl and A. Moshovos new firs
- Page 273 and 274:
266 P. Akl and A. Moshovos throttli
- Page 275 and 276:
268 P. Akl and A. Moshovos 80% 70%
- Page 277 and 278:
270 P. Akl and A. Moshovos 25% 20%
- Page 279:
272 P. Akl and A. Moshovos [4] Burg
- Page 282 and 283:
274 A. García et al. execution tim
- Page 284 and 285: 276 A. García et al. whenever LPA
- Page 286 and 287: 278 A. García et al. @12: load r2,
- Page 288 and 289: 280 A. García et al. Target Loop E
- Page 290 and 291: 282 A. García et al. reduction 100
- Page 292 and 293: 284 A. García et al. IPC speedup 7
- Page 294 and 295: 286 A. García et al. SPECfp benchm
- Page 297 and 298: Complementing Missing and Inaccurat
- Page 299 and 300: 90 100 100 25 75 25 25 100 100 10 1
- Page 301 and 302: Complementing Missing and Inaccurat
- Page 303 and 304: Complementing Missing and Inaccurat
- Page 305 and 306: Complementing Missing and Inaccurat
- Page 307 and 308: 6.1 Filling Edge Profile from Verte
- Page 309 and 310: Complementing Missing and Inaccurat
- Page 311 and 312: Using Dynamic Binary Instrumentatio
- Page 313 and 314: L1 D-Cache Miss Rate (%) CPI 5 4 3
- Page 315 and 316: Using Dynamic Binary Instrumentatio
- Page 317 and 318: Using Dynamic Binary Instrumentatio
- Page 319 and 320: CPI Error (%) 10 5 0 -5 -10 FP Resu
- Page 321 and 322: CPI Error (%) 40 30 20 10 0 Using D
- Page 323 and 324: Using Dynamic Binary Instrumentatio
- Page 325: Using Dynamic Binary Instrumentatio
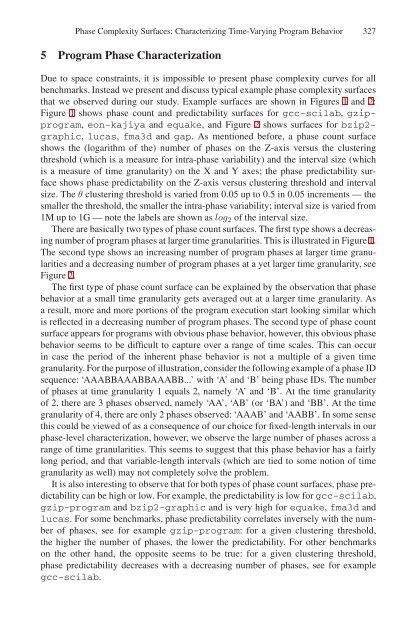
- Page 328 and 329: Phase Complexity Surfaces: Characte
- Page 330 and 331: Phase Complexity Surfaces: Characte
- Page 332 and 333: Phase Complexity Surfaces: Characte
- Page 336 and 337: ( log10) phases of Number 4.0 3.5 3
- Page 338 and 339: Phase Complexity Surfaces: Characte
- Page 340 and 341: Phase Complexity Surfaces: Characte
- Page 343 and 344: MLP-Aware Dynamic Cache Partitionin
- Page 345 and 346: MLP-Aware Dynamic Cache Partitionin
- Page 347 and 348: MLP-Aware Dynamic Cache Partitionin
- Page 349 and 350: MLP-Aware Dynamic Cache Partitionin
- Page 351 and 352: MLP-Aware Dynamic Cache Partitionin
- Page 353 and 354: (a) IPC as we vary the number of as
- Page 355 and 356: MLP-Aware Dynamic Cache Partitionin
- Page 357 and 358: MLP-Aware Dynamic Cache Partitionin
- Page 359 and 360: Compiler Techniques for Reducing Da
- Page 361 and 362: Compiler Techniques for Reducing Da
- Page 363 and 364: Compiler Techniques for Reducing Da
- Page 365 and 366: Compiler Techniques for Reducing Da
- Page 367 and 368: Compiler Techniques for Reducing Da
- Page 369 and 370: Compiler Techniques for Reducing Da
- Page 371 and 372: 40 35 30 25 ) te ( % 20 -ra M is s
- Page 373 and 374: References Compiler Techniques for
- Page 375 and 376: Code Arrangement of Embedded Java V
- Page 377 and 378: Code Arrangement of Embedded Java V
- Page 379 and 380: Code Arrangement of Embedded Java V
- Page 381 and 382: Code Arrangement of Embedded Java V
- Page 383 and 384: Code Arrangement of Embedded Java V
- Page 385 and 386:
Code Arrangement of Embedded Java V
- Page 387 and 388:
Code Arrangement of Embedded Java V
- Page 389:
Code Arrangement of Embedded Java V
- Page 392 and 393:
Aggressive Function Inlining: Preve
- Page 394 and 395:
f1(){ ...g();....} f2(){....q();...
- Page 396 and 397:
Aggressive Function Inlining: Preve
- Page 398 and 399:
Aggressive Function Inlining: Preve
- Page 400 and 401:
foo:(80 times) BB1: Call bar BB2: C
- Page 402 and 403:
Aggressive Function Inlining: Preve
- Page 404 and 405:
Aggressive Function Inlining: Preve
- Page 406:
400 Author Index Shajrawi, Yousef 3