THESE UNIQUE El Hassane Kéhien-Piho TOU - Nutridev
THESE UNIQUE El Hassane Kéhien-Piho TOU - Nutridev
THESE UNIQUE El Hassane Kéhien-Piho TOU - Nutridev

Create successful ePaper yourself
Turn your PDF publications into a flip-book with our unique Google optimized e-Paper software.
E.H. Tou et al. / Food Chemistry 100 (2007) 935–943 939<br />
Concentration (mmol/l)<br />
12<br />
10<br />
8<br />
6<br />
4<br />
2<br />
Concentration (mmol/L)<br />
12<br />
10<br />
8<br />
6<br />
4<br />
2<br />
A<br />
0 0<br />
0 4 8 12 16 20 24<br />
0 4 8 12 16 20 24<br />
Fermentation time (h)<br />
B<br />
Fermentation time (h)<br />
Concentration (mmol/L)<br />
C<br />
80<br />
70<br />
60<br />
50<br />
40<br />
30<br />
20<br />
10<br />
0<br />
Concentration (mmol/L)<br />
0<br />
0 4 8 12 16 20 24<br />
0 4 8 12 16 20 24<br />
Fermentation time (h)<br />
D<br />
Fermentation time (h)<br />
Glucose Melibiose Maltose Fructose<br />
80<br />
70<br />
60<br />
50<br />
40<br />
30<br />
20<br />
10<br />
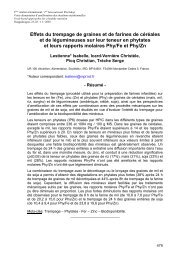
Fig. 3. Kinetics of sugar consumption and formation during fermentation at the settling step in control (A) and CI (B), CM (C) and CMI (D) process<br />
combinations. Bars are standard deviations.<br />
3.2. Effect of the different process combinations on<br />
microflora during the fermentation step<br />
To assess the effect of the process combinations on<br />
microflora (mesophilic aerobic bacteria, yeasts, lactic acid<br />
bacteria -LAB- and amylolytic lactic acid bacteria<br />
-ALAB-) microbiological analyses were performed during<br />
the fermentation step (Table 1).<br />
Except for the process combination including pre-cooking<br />
and the addition of malt (CM), LAB were the dominant<br />
microflora isolated from the samples taken during<br />
fermentation. Among the samples obtained after the three<br />
different process combinations, the CM samples had the<br />
lowest counts for all microorganisms. The main effect of<br />
pre-cooking was to reduce the LAB concentration to undetectable<br />
levels at the beginning of the fermentation stage<br />
(Table 1). However, growth of LAB was detected during<br />
fermentation in the CM samples reaching a lower final concentration<br />
than those observed for samples from other process<br />
combinations. Surprisingly, no ALAB were found in<br />
the samples taken during the fermentation step in the<br />
CM process combination. The number of mesophilic aerobic<br />
bacteria and yeasts was also affected by pre-cooking<br />
and increased slowly during the settling step but were nevertheless<br />
from 10 3 to 10 4 times lower than for the other process<br />
combinations at the end of fermentation. Since LAB<br />
were detected during fermentation despite the fact they<br />
were drastically affected by pre-cooking, they were most<br />
probably introduced after pre-cooking through recontamination<br />
by the added malt and/or environmental conditions<br />
(air, dust, etc.). Microbial counts during the fermentation<br />
step of both process combinations with inoculation (CI<br />
and CMI) followed a similar pattern to that of the control.<br />
Inoculation after pre-cooking allowed the bacterial population<br />
to be restored to a similar level to that of the control at<br />
the beginning of the settling step. For yeasts, compared to<br />
the other process combinations, the process combination<br />
including inoculation and the addition of malt (CMI) was<br />
seen to favour their growth, and this process combination<br />
bears a certain similarity to the traditional brewing processes<br />
used to produce African beers.<br />
3.3. Effect of different process combinations on gruel<br />
consistency and energy density<br />
In order to assess the effect of the three different process<br />
combinations on gruel consistency, five gruels with different<br />
dry matter (DM) contents were prepared for each process<br />
combination and their Bostwick flow was measured<br />
(Fig. 5).