THESE UNIQUE El Hassane Kéhien-Piho TOU - Nutridev
THESE UNIQUE El Hassane Kéhien-Piho TOU - Nutridev
THESE UNIQUE El Hassane Kéhien-Piho TOU - Nutridev

You also want an ePaper? Increase the reach of your titles
YUMPU automatically turns print PDFs into web optimized ePapers that Google loves.
E.H. Tou et al. / International Journal of Food Microbiology 106 (2006) 52–60 57<br />
mmol/l<br />
mmol/100g of DM<br />
1.2<br />
1.0<br />
0.8<br />
0.6<br />
0.4<br />
0.2<br />
0.0<br />
25<br />
20<br />
15<br />
10<br />
5<br />
0<br />
SUPERNATANT<br />
GRAINS<br />
0 4 8 12 16 20 24 28 32 36<br />
Soaking time (h)<br />
glucose fructose sucrose<br />
maltose raffinose melibiose<br />
stachyose<br />
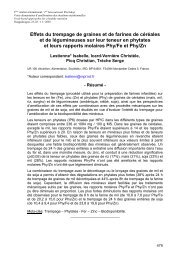
Fig. 3. Changes in sugars in grains and in the supernatant during soaking. Bars<br />
indicate standard deviation.<br />
Concentration (mmol/l)<br />
Temperature (°C)<br />
60<br />
50<br />
40<br />
30<br />
20<br />
10<br />
50<br />
40<br />
30<br />
20<br />
10<br />
SETTLING<br />
0 0<br />
SOAKING<br />
0<br />
0 4 8 12 16 20 24 28 32 36<br />
Time (h)<br />
Temperature Ethanol Acetate<br />
Lactate pH<br />
7<br />
6<br />
5<br />
4<br />
3<br />
2<br />
1<br />
6<br />
5<br />
4<br />
3<br />
2<br />
1<br />
0<br />
pH pH<br />
In addition to these results, microbial counts were determined<br />
in samples from different TPUs. In the unfermented wet<br />
flour, counts were similar for the lactic acid bacteria and yeasts<br />
(Table 4). Consistent with the fermentation patterns, at the end<br />
of the fermentation LAB increased and became the dominant<br />
microflora whereas yeasts decreased, though yeasts were still<br />
present. Moreover, amylolytic lactic acid bacteria (ALAB)<br />
were counted and found to increase during fermentation (from<br />
5.1 to 6.1 log CFU/ml). However, the ALAB/LAB ratio (12%)<br />
was constant (Table 4).<br />
4. Discussion<br />
As the flow diagram of ben-saalga production (Fig. 1)<br />
shows, the processing of pearl millet is similar to that of other<br />
African traditional processing of cereals into fermented dough<br />
and pastes such as mawè, ogi in Benin, Ghana, Nigeria<br />
(Blandino et al., 2003; Hounhouigan et al., 1993; Odunfa and<br />
Table 3<br />
Main biochemical characteristics of products during the processing of pearl<br />
millet into ben-saalga in 24 TPUs (results are mean values in g/100 g DM with<br />
standard deviation)<br />
Dry<br />
matter<br />
Protein<br />
Phytate<br />
(IP6)<br />
Sucrose<br />
Raffinose<br />
Washed grains 76.7T8.3 10.2T0.6 0.67T0.05 1.09T0.33 0.48T0.23<br />
Soaked grains 59.3T2 10.1T0.6 0.63T0.10 0.27T0.17 0.21T0.16<br />
Unfermented paste 7T3.2 8.7T1.2 0.51T0.13 0.03T0.02 0.04T0.05<br />
Fermented paste 39.2T9.9 6.0T2.1 0.18T0.12 0.01T0.01 0.08T0.27<br />
Ben-saalga 7.4T1.4 – 0.16T0.07 – –<br />
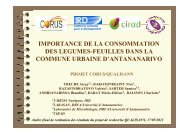
Fig. 4. Changes in pH, temperature, ethanol, acetic and lactic acid concentrations<br />
in supernatant during soaking and settling in pilot scale experiments. Bars<br />
indicate standard deviation.<br />
Adeyele, 1985; Tomkins et al., 1988). Without claiming to<br />
thoroughly describe the nutritional characteristics of bensaalga<br />
(further investigations are currently underway), some<br />
preliminary conclusions can be drawn from the results. In<br />
agreement with previous results (Svanberg and Lorri, 1997), in<br />
all the TPUs investigated, during the lactic acid fermentation<br />
step (settling) there was natural degradation of phytate, an antinutritional<br />
factor (ANF) that reduces the bioavailability of<br />
mineral micronutrients. As for a-galactosides such as raffinose,<br />
Lactic acid; ethanol (mmol/l)<br />
60<br />
50<br />
40<br />
30<br />
20<br />
10<br />
0<br />
Lactic acid<br />
Ethanol<br />
PSE (14h) TPU (14h) PSE (24h) TPU (24h)<br />
Fig. 5. Comparison between five traditional production units (TPU) and pilot<br />
scale experiments (PSE) for lactic acid and ethanol concentrations in<br />
supernatant during soaking. Bars indicate standard deviation.