planos de gestão de resíduos sólidos - Ministério do Meio Ambiente
planos de gestão de resíduos sólidos - Ministério do Meio Ambiente
planos de gestão de resíduos sólidos - Ministério do Meio Ambiente

You also want an ePaper? Increase the reach of your titles
YUMPU automatically turns print PDFs into web optimized ePapers that Google loves.
54<br />
ORIENTAÇÕES PARA ELABORAÇÃO DOS PLANOS<br />
<br />
% coleta<br />
90<br />
80<br />
70<br />
60<br />
50<br />
40<br />
30<br />
20<br />
10<br />
0<br />
Massa específica aparente <strong>de</strong> <strong>resíduos</strong><br />
<strong>do</strong>miciliares:<br />
soltos: 250 kg/m 3<br />
compacta<strong>do</strong>s: 600 kg/m 3<br />
Resíduos da Limpeza Pública<br />
Os <strong>resíduos</strong> resultantes das ativida<strong>de</strong>s <strong>de</strong> limpeza<br />
pública representam cerca <strong>de</strong> 15% da geração total<br />
<strong>de</strong> <strong>resíduos</strong> <strong>do</strong>miciliares, excluída a quantida<strong>de</strong><br />
<strong>de</strong> <strong>resíduos</strong> <strong>de</strong> construção em <strong>de</strong>posições irregulares.<br />
Na limpeza <strong>de</strong> feiras públicas alguns municípios convivem<br />
com taxas <strong>de</strong> geração <strong>de</strong> aproximadamente 6 kg<br />
anuais per capita (GUARULHOS, 2010). Já na varrição, o<br />
Manual <strong>de</strong> Saneamento da FUNASA registra taxas que<br />
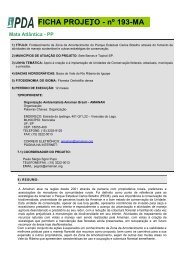
DIAGNÓSTICO: ORIGEM DOS RCC REMOVIDOS POR<br />
TRANSPORTADORES<br />
S. André S. J. R. Preto R. Preto Jundiaí V. Conquista<br />
<br />
variam <strong>de</strong> 0,85 a 1,26 m 3 diários <strong>de</strong> <strong>resíduos</strong> por km<br />
varri<strong>do</strong>. A quantida<strong>de</strong> <strong>de</strong>stes <strong>resíduos</strong> está vinculada à<br />
extensão <strong>do</strong> serviço. Além <strong>do</strong>s registros locais, po<strong>de</strong>m<br />
ser consulta<strong>do</strong>s os da<strong>do</strong>s <strong>do</strong> SNIS 2008 que apresenta<br />
a extensão média varrida nos municípios pesquisa<strong>do</strong>s<br />
– 0,27 km/hab (FUNASA, 2006; MCida<strong>de</strong>s, 2010).<br />
A limpeza corretiva <strong>de</strong> pontos vicia<strong>do</strong>s, observada<br />
em inventários <strong>de</strong> diversos municípios têm mostra<strong>do</strong><br />
que cerca <strong>de</strong> 20% <strong>do</strong>s <strong>resíduos</strong> <strong>de</strong> construção po<strong>de</strong><br />
estar <strong>de</strong>posita<strong>do</strong> nestes pontos. Em alguns municípios<br />
importantes os inventários revelaram percentuais<br />
próximos <strong>de</strong> 50%.<br />
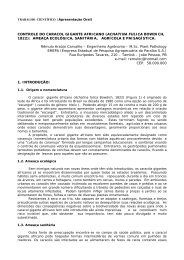
Resíduos da Construção Civil e Demolição – RCC<br />
O levantamento <strong>de</strong> números confiáveis sobre estes<br />
<strong>resíduos</strong> <strong>de</strong>pen<strong>de</strong> <strong>do</strong> levantamento <strong>de</strong> informações<br />
diretamente com agentes externos à administração<br />
pública. Em gran<strong>de</strong> número <strong>do</strong>s casos os transporta<strong>do</strong>res<br />
priva<strong>do</strong>s são responsáveis por até 80% <strong>do</strong> manejo<br />
<strong>de</strong>ste material – para um bom diagnóstico os caçambeiros,<br />
carroceiros e outros coletores autônomos<br />
<strong>de</strong>vem ser consulta<strong>do</strong>s. Para a quantificação po<strong>de</strong>-se<br />
utilizar a meto<strong>do</strong>logia apresentada no Manual “Manejo<br />
e Gestão <strong>de</strong> Resíduos da Construção Civil”, edita<strong>do</strong><br />
pelos <strong>Ministério</strong>s das Cida<strong>de</strong>s e <strong>do</strong> <strong>Meio</strong> <strong>Ambiente</strong> e<br />
Caixa Econômica Fe<strong>de</strong>ral (PINTO; GONZÁLES, 2005a).<br />
Os inventários revelam uma relação entre estes <strong>resíduos</strong><br />
e os <strong>resíduos</strong> <strong>do</strong>miciliares<strong>de</strong> <strong>do</strong>is para um.<br />
A média estimada como geração típica per capita é <strong>de</strong><br />
520 quilos anuais, po<strong>de</strong>n<strong>do</strong> crescer em cida<strong>de</strong>s com economia<br />
mais forte e reduzir-se em municípios menores.<br />
ICLEI 54 3/21/12 5:03 PM