PDF-Version - am Institut für Baustatik
PDF-Version - am Institut für Baustatik
PDF-Version - am Institut für Baustatik

Erfolgreiche ePaper selbst erstellen
Machen Sie aus Ihren PDF Publikationen ein blätterbares Flipbook mit unserer einzigartigen Google optimierten e-Paper Software.
As is the case with Maple-detected errors, the computation is then interrupted and aborted.<br />
11.7.2 lasterror and traperror<br />
The variable lasterror records the most recent kind of ERROR. The function traperror evaluates an<br />
expression sequence and returns the value if there were no errors, or lasterror if there was an error.<br />
You can use these two features in combination to control error handling yourself instead of just having<br />
Maple interrupt and abort processing.<br />
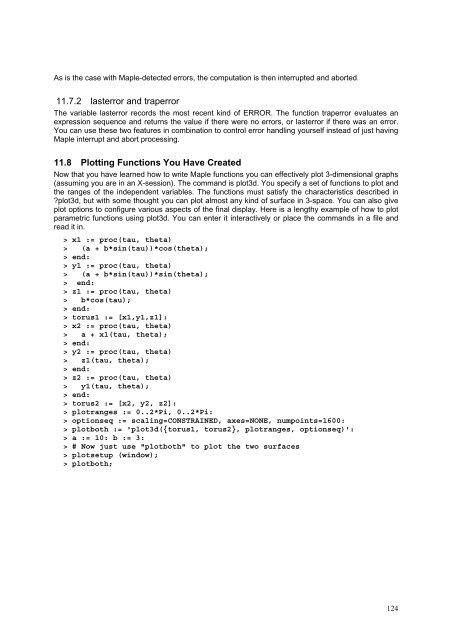
11.8 Plotting Functions You Have Created<br />
Now that you have learned how to write Maple functions you can effectively plot 3-dimensional graphs<br />
(assuming you are in an X-session). The command is plot3d. You specify a set of functions to plot and<br />
the ranges of the independent variables. The functions must satisfy the characteristics described in<br />
?plot3d, but with some thought you can plot almost any kind of surface in 3-space. You can also give<br />
plot options to configure various aspects of the final display. Here is a lengthy ex<strong>am</strong>ple of how to plot<br />
par<strong>am</strong>etric functions using plot3d. You can enter it interactively or place the commands in a file and<br />
read it in.<br />
> x1 := proc(tau, theta)<br />
> (a + b*sin(tau))*cos(theta);<br />
> end:<br />
> y1 := proc(tau, theta)<br />
> (a + b*sin(tau))*sin(theta);<br />
> end:<br />
> z1 := proc(tau, theta)<br />
> b*cos(tau);<br />
> end:<br />
> torus1 := [x1,y1,z1]:<br />
> x2 := proc(tau, theta)<br />
> a + x1(tau, theta);<br />
> end:<br />
> y2 := proc(tau, theta)<br />
> z1(tau, theta);<br />
> end:<br />
> z2 := proc(tau, theta)<br />
> y1(tau, theta);<br />
> end:<br />
> torus2 := [x2, y2, z2]:<br />
> plotranges := 0..2*Pi, 0..2*Pi:<br />
> optionseq := scaling=CONSTRAINED, axes=NONE, numpoints=1600:<br />
> plotboth := 'plot3d({torus1, torus2}, plotranges, optionseq)':<br />
> a := 10: b := 3:<br />
> # Now just use "plotboth" to plot the two surfaces<br />
> plotsetup (window);<br />
> plotboth;<br />
124