- Page 1 and 2:
D E K K E R Handbook of Turbomachin
- Page 3 and 4:
MECHANICAL ENGINEERING A Series of
- Page 5 and 6:
61 Computer-Aided Simulation in Rai
- Page 7 and 8:
127 Designing for Product Sound Qua
- Page 9 and 10:
Preface to the Second Edition The o
- Page 11 and 12:
Preface to the Second Edition Prefa
- Page 13 and 14:
Contributors Nathan G. Adams The Bo
- Page 15 and 16:
1 Introduction Earl Logan, Jr.*, an
- Page 17 and 18:
HISTORICAL BACKGROUND Earl Logan, J
- Page 19 and 20:
MECHANICAL AND THERMAL DESIGN CONSI
- Page 21 and 22:
Figure 1 Cross-section showing the
- Page 23 and 24:
Figure 2 Turboprop engine, TPE 331-
- Page 25 and 26:
Figure 4 Auxiliary power unit, APU1
- Page 27 and 28:
Durability. The mechanical and ther
- Page 29 and 30:
with time during flight. Such a typ
- Page 31 and 32:
experience and existing similar des
- Page 33 and 34:
adverse pressure gradient against w
- Page 35 and 36:
and its attachments. A substantial
- Page 37 and 38:
Figure 9 Typical high-pressure turb
- Page 39 and 40:
and the measurement of local heat-t
- Page 41 and 42:
due to cyclic operation. In additio
- Page 43 and 44:
the steady and transient conditions
- Page 45 and 46:
Table 3(a) Steps in a Three-Dimensi
- Page 47 and 48:
Figure 16 Schematic Goodman diagram
- Page 49 and 50:
occur due to particles of unburned
- Page 51 and 52:
pressures at critical points. These
- Page 53 and 54:
1. Ceramics are subject to ‘‘in
- Page 55 and 56:
with Transient Tests and Surface Co
- Page 57 and 58:
Overall engine performance goals tr
- Page 59 and 60:
Much of the complexity of turbomach
- Page 61 and 62:
End-wall boundary layers can also h
- Page 63 and 64:
pressure at the wake centerline. Th
- Page 65 and 66:
the same vaneless diffuser and shro
- Page 67 and 68:
from internal cooling passages, thr
- Page 69 and 70:
Further downstream, the wake was ev
- Page 71 and 72:
to its original position. This unst
- Page 73 and 74:
cooling film was found to trip the
- Page 75 and 76:
shroud static pressure and the exit
- Page 77 and 78:
stage in the design process allows
- Page 79 and 80:
Flow Physics Modeling Modeling of t
- Page 81 and 82:
passage to the next, assuming that
- Page 83 and 84: The next step in modeling accuracy
- Page 85 and 86: tend to be large, due to the necess
- Page 87 and 88: Navier-Stokes equations are time-ma
- Page 89 and 90: To satisfy these requirements, it i
- Page 91 and 92: are discussed by a number of author
- Page 93 and 94: source code, and to assign each seg
- Page 95 and 96: selected locations in the flow path
- Page 97 and 98: of the component designers must be
- Page 99 and 100: Trends in Flow Modeling Capabilitie
- Page 101 and 102: optimize the flow behavior. The eff
- Page 103 and 104: 20. D. Eckardt, ‘‘Flow Field An
- Page 105 and 106: 49. K. R. Kirtley, ‘‘An Algebra
- Page 107 and 108: INTRODUCTION 3 Turbine Gas-Path Hea
- Page 109 and 110: Figure 1 Maximum turbine rotor inle
- Page 111 and 112: Figure 2 Intersecting S1 and S2 sur
- Page 113 and 114: determination. Nothing in the simpl
- Page 115 and 116: e well matched with the engine. The
- Page 117 and 118: case different forms of the popular
- Page 119 and 120: volume will be equal to the accumul
- Page 121 and 122: Figure 9 Nusselt number vs. vane su
- Page 123 and 124: Furthermore, to keep computer time
- Page 125 and 126: Figure 12 Comparison of three turbu
- Page 127 and 128: and small and cooled and uncooled t
- Page 129 and 130: Figure 15 Miniature heat flux gauge
- Page 131 and 132: Figure 17 Time resolved heat transf
- Page 133: Figure 19 Surface pressure changes
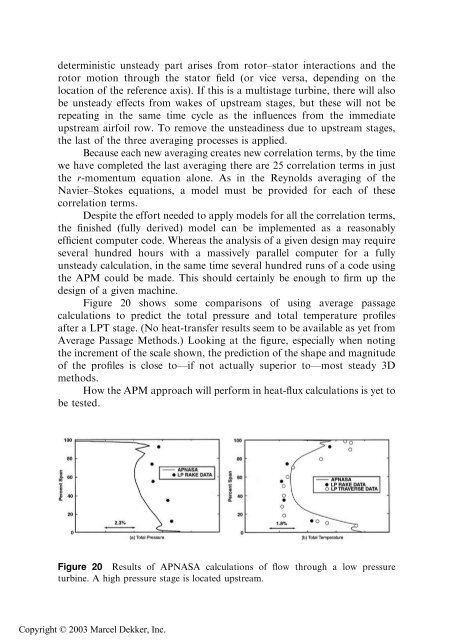
- Page 137 and 138: Figure 22 Typical distributions of
- Page 139 and 140: 4. Better instrumentation for heat-
- Page 141 and 142: 24. R. H. Ni, ‘‘A Multiple Grid
- Page 143 and 144: 4 Selection of a Gas Turbine Coolin
- Page 145 and 146: Re L ¼ rVL=m—Reynolds number bas
- Page 147 and 148: (1,300 8F). But modern gas turbines
- Page 149 and 150: during engine operation are compati
- Page 151 and 152: Figure 3 Airfoil cooling techniques
- Page 153 and 154: expected to increase this limit to
- Page 155 and 156: 1. Reduce the effect of main-stream
- Page 157 and 158: P? is total inlet pressure. Tc=T? i
- Page 159 and 160: thereby increasing both the skin-fr
- Page 161 and 162: After four decades of advancement i
- Page 163 and 164: correspondingly high coolant-side t
- Page 165 and 166: component. Use of a hot cascade for
- Page 167 and 168: nozzle vanes is limited by their ox
- Page 169 and 170: Figure 9 Typical turbine hot sectio
- Page 171 and 172: important factor to consider for tr
- Page 173 and 174: Figure 10 Evolution of nozzle geome
- Page 175 and 176: the exit of the combustor section f
- Page 177 and 178: Figure 12 Inlet turbulence effect o
- Page 179 and 180: in heat transfer as the Reynolds nu
- Page 181 and 182: easonably well using correlations e
- Page 183 and 184: in the section on blade cooling tha
- Page 185 and 186:
mass flow rate (e.g., M ¼ 1 for a
- Page 187 and 188:
holes. Cooling hole pattern is an i
- Page 189 and 190:
coolant flow with the main stream,
- Page 191 and 192:
above equation assumes a constant f
- Page 193 and 194:
Figure 15 Definition of film-coolin
- Page 195 and 196:
edistribution of the external heat-
- Page 197 and 198:
Three-Dimensional Effects The three
- Page 199 and 200:
In order to achieve the bulk metal
- Page 201 and 202:
coefficient is given by Nud ¼ hd=k
- Page 203 and 204:
Where G ¼ 2:24ðw=tÞ 0:1 ðReeÞ
- Page 205 and 206:
pressure drop. The 608/458 V-shaped
- Page 207 and 208:
Some of the studies have found that
- Page 209 and 210:
of the cooling air and the turning
- Page 211 and 212:
Figure 20 Impingement geometry defi
- Page 213 and 214:
correlated by Nu a d ¼ 0:63ðGd=m
- Page 215 and 216:
tangentially to the inner wall, beh
- Page 217 and 218:
The effectiveness of a suction surf
- Page 219 and 220:
vortex structure. Their studies sho
- Page 221 and 222:
Figure 23 Effect of preswirler pres
- Page 223 and 224:
component to the cooling air that c
- Page 225 and 226:
axial gap. A static pressure variat
- Page 227 and 228:
Weight, cost, and complexity constr
- Page 229 and 230:
Figure 28 Effectiveness of liner co
- Page 231 and 232:
thickness. A problem this poses is
- Page 233 and 234:
portion of the hole has been shown
- Page 235 and 236:
unacceptable engine performance pen
- Page 237 and 238:
analysis, in order to provide accur
- Page 239 and 240:
Figure 30 Application of PSP for fi
- Page 241 and 242:
thermocouple positioned close to th
- Page 243 and 244:
spray-painted black (Hallcrest, BB-
- Page 245 and 246:
Figure 32 Schematics of a hot casca
- Page 247 and 248:
the turbine static temperature (rot
- Page 249 and 250:
Figure 33 Experimental rig for inve
- Page 251 and 252:
their color when exposed to higher
- Page 253 and 254:
margins defined within each discipl
- Page 255 and 256:
them. The larger gas-path divergenc
- Page 257 and 258:
Figure 36 Blade-cooling selection d
- Page 259 and 260:
8. B. Barry, Turbine Blade Cooling:
- Page 261 and 262:
40. A. K. Tolpadi and M. E. Crawfor
- Page 263 and 264:
73. R. S. Abhari, ‘‘Comparison
- Page 265 and 266:
106. J. M. Owen and R. H. Rogers, F
- Page 267 and 268:
138. I. Egorov, G. Kretinin, I. Les
- Page 269 and 270:
integrity (stress levels) will have
- Page 271 and 272:
Figure 1 Instant entropy contours o
- Page 273 and 274:
Aerodynamic Interaction (Unsteady L
- Page 275 and 276:
Figure 3 Pitchwise time-averaged en
- Page 277 and 278:
The above considerations are all fo
- Page 279 and 280:
lades, the wavelength of the distur
- Page 281 and 282:
forcing and damping, and hence the
- Page 283 and 284:
frequency and its higher harmonics
- Page 285 and 286:
The two-cell pattern with a relativ
- Page 287 and 288:
Figure 9 Typical blade flutter boun
- Page 289 and 290:
field is generated to satisfy the t
- Page 291 and 292:
Figure 11 Instant static pressure c
- Page 293 and 294:
Figure 12 Calculated instantaneous
- Page 295 and 296:
Figure 14 Time-space static pressur
- Page 297 and 298:
one period Tp (neglecting change of
- Page 299 and 300:
It should be noted that the effects
- Page 301 and 302:
There are some further points to no
- Page 303 and 304:
Figure 17 Flow around an NACA-65 ai
- Page 305 and 306:
(11) for a simple case]: Where WA
- Page 307 and 308:
Regardless whether loosely coupled
- Page 309 and 310:
Several methods have been developed
- Page 311 and 312:
significant difference is introduce
- Page 313 and 314:
losses, but it may affect to a mini
- Page 315 and 316:
when we refine a mesh in an unstead
- Page 317 and 318:
8. W. S. Barankiewicz and M. D. Hat
- Page 319 and 320:
6 Fundamentals of Compressor Design
- Page 321 and 322:
Figure 3 AlliedSignal 331 turboprop
- Page 323 and 324:
each of the selected radii. The pro
- Page 325 and 326:
components of gas velocity upstream
- Page 327 and 328:
Observe that each of the curves for
- Page 329 and 330:
The conservation of angular momentu
- Page 331 and 332:
allowable static pressure ratio of
- Page 333 and 334:
Figure 7 Boundary layers and wakes
- Page 335 and 336:
component that is perpendicular to
- Page 337 and 338:
Figure 10 (a) Deflection of flow of
- Page 339 and 340:
increase in the downstream pressure
- Page 341 and 342:
Mach number at a compressor outlet
- Page 343 and 344:
Figure 12 Sketch of flow surface an
- Page 345 and 346:
useful shapes and orientations of b
- Page 347 and 348:
where G and oa are constant along a
- Page 349 and 350:
There is a good reason for this sit
- Page 351 and 352:
Projected Shape in Meridional Plane
- Page 353 and 354:
inherent flow range of the impeller
- Page 355 and 356:
compressors. Multistage centrifugal
- Page 357 and 358:
turbines. In these designs the high
- Page 359 and 360:
Corrections for Streamline Curvatur
- Page 361 and 362:
Preparation of Maps Once the losses
- Page 363 and 364:
that circumferential gradients meas
- Page 365 and 366:
Nastran, which was developed by NAS
- Page 367 and 368:
tests. One should take pains to pro
- Page 369 and 370:
e predicted in advance. Total press
- Page 371 and 372:
Cv Coefficient of heat at constant
- Page 373 and 374:
15. S. Lieblein, J. Basic Eng., Tra
- Page 375 and 376:
INTRODUCTION 7 Fundamentals of Turb
- Page 377 and 378:
Figure 1 Cross sections of generic
- Page 379 and 380:
espectively. Radial-inflow turbines
- Page 381 and 382:
Figure 4 Typical rotor blade shapes
- Page 383 and 384:
Figure 6 The expansion process acro
- Page 385 and 386:
the average for the gas flowing thr
- Page 387 and 388:
etween the velocity diagram and the
- Page 389 and 390:
gas dynamics relation p 00 p ¼ T 0
- Page 391 and 392:
Figure 9 Variations in turbine velo
- Page 393 and 394:
pressure, inlet losses are usually
- Page 395 and 396:
diffuser recovery, defined as Rp ¼
- Page 397 and 398:
different turbines easier, dimensio
- Page 399 and 400:
where and y ¼ T 0 in TSTD d ¼ p0
- Page 401 and 402:
sizing exercises where the details
- Page 403 and 404:
where Rth is the Reynolds number ba
- Page 405 and 406:
order to determine the overall turb
- Page 407 and 408:
The classical approach to satisfyin
- Page 409 and 410:
clearance. Since tip clearance repr
- Page 411 and 412:
turbine with an effective diffuser,
- Page 413 and 414:
atio ðp 0 in =pdisÞ is 3. The sta
- Page 415 and 416:
Automation of Calculations and Trad
- Page 417 and 418:
and for the rotor Zrotor ¼ ð0:1Þ
- Page 419 and 420:
the energy extracted and the rotor
- Page 421 and 422:
RADIAL-INFLOW TURBINE SIZING Differ
- Page 423 and 424:
interpolations from existing design
- Page 425 and 426:
Glassman [1], the optimum ratio of
- Page 427 and 428:
design fault in the radial-inflow t
- Page 429 and 430:
[27]. In order to avoid manufacturi
- Page 431 and 432:
The rotor exit critical velocity is
- Page 433 and 434:
The hub-to-tip radius ratio at the
- Page 435 and 436:
REFERENCES 1. A. J. Glassman (ed.),
- Page 437 and 438:
8 Steam Turbines Thomas H. McCloske
- Page 439 and 440:
Figure 3 Reciprocating steam engine
- Page 441 and 442:
This process began in the 1920s, al
- Page 443 and 444:
First Law of Thermodynamics The fir
- Page 445 and 446:
the amount of fuel burned and the p
- Page 447 and 448:
Figure 7 Rankine cycle temperature-
- Page 449 and 450:
The Mollier diagram is quite useful
- Page 451 and 452:
Figure 10 Theoretical Rankine cycle
- Page 453 and 454:
stages of the turbine is at a highe
- Page 455 and 456:
calculate the relevant thermodynami
- Page 457 and 458:
Figure 14 Steam leakage losses for
- Page 459 and 460:
can reveal nozzle and/or blade eros
- Page 461 and 462:
Figure 17 Enlarged portion of the M
- Page 463 and 464:
Traditionally, pressures have been
- Page 465 and 466:
Figure 21 Wetness thermodynamic los
- Page 467 and 468:
Figure 23 Radial steam turbine flow
- Page 469 and 470:
Figure 25 Percentage stage reaction
- Page 471 and 472:
The power output of the stage can b
- Page 473 and 474:
the LP turbines is split into paral
- Page 475 and 476:
Turbine Inlet Two stages in particu
- Page 477 and 478:
of 20%, which would cause excessive
- Page 479 and 480:
Figure 30 Typical low-pressure stea
- Page 481 and 482:
ductility and poor toughness, since
- Page 483 and 484:
‘‘tramp’’ elements to minim
- Page 485 and 486:
End Seals End seals or packing glan
- Page 487 and 488:
Drains Condensate can form during s
- Page 489 and 490:
Figure 32 Steam turbine blade roots
- Page 491 and 492:
Figure 34 Cross-section view of thr
- Page 493 and 494:
Figure 36 Interblade shroud and Tie
- Page 495 and 496:
Where The influence of notch sensit
- Page 497 and 498:
Similarly, LP turbine blades are su
- Page 499 and 500:
those made of steel. Note, however,
- Page 501 and 502:
esult, significant attention must b
- Page 503 and 504:
Figure 38 Centrifugal stresses on a
- Page 505 and 506:
Figure 39 Centrifugal bending stres
- Page 507 and 508:
onto the rotating blade. These can
- Page 509 and 510:
Vortex shedding from blade trailing
- Page 511 and 512:
Figure 42 Torsional coupled vibrati
- Page 513 and 514:
Figure 44 Stall flutter of low-pres
- Page 515 and 516:
Start-Stop Transients/Overspeeds La
- Page 517 and 518:
(4) ellipiticity, such as caused by
- Page 519 and 520:
Figure 47 Campbell diagram (frequen
- Page 521 and 522:
Furthermore, in practice each manuf
- Page 523 and 524:
Figure 49 Modal diameters of a low-
- Page 525 and 526:
Figure 51 Three-dimensional computa
- Page 527 and 528:
Figure 52 Converging wedge and resu
- Page 529 and 530:
value as the operating value of uv/
- Page 531 and 532:
Lubrication Supply System Design De
- Page 533 and 534:
Figure 56 Steam turbine oil system
- Page 535 and 536:
The main oil reservoir is located b
- Page 537 and 538:
Although a light oil does provide a
- Page 539 and 540:
temperatures are suspected as reaso
- Page 541 and 542:
There is no fixed or absolute value
- Page 543 and 544:
pivots incorporated in this bearing
- Page 545 and 546:
covers and doors. Pipe scale, rust,
- Page 547 and 548:
Figure 63 Mechanical hydraulic cont
- Page 549 and 550:
Figure 64 Steam turbine electro-hyd
- Page 551 and 552:
Figure 65 Steam turbine electro-hyd
- Page 553 and 554:
generator rotor moment of inertia h
- Page 555 and 556:
the turbine against overspeed. This
- Page 557 and 558:
an additional electronic overspeed
- Page 559 and 560:
Figure 68 Steam turbine protective
- Page 561 and 562:
3. Need for better understanding of
- Page 563 and 564:
REFERENCES 1. J. C. Zink, ‘‘Ste
- Page 565 and 566:
No. TWDPS-1, The American Society o
- Page 567 and 568:
58. A. V. Sarlashkar and T. C. T. L
- Page 569 and 570:
81. IEEE Guide for Abnormal Frequen
- Page 571 and 572:
Atlanta, GA, Oct. 18-22, 1992, PWR-
- Page 573 and 574:
Performance Enhancement Program, he
- Page 575 and 576:
of the design process toward achiev
- Page 577 and 578:
procedure capable of addressing mul
- Page 579 and 580:
to achieve a specific target pressu
- Page 581 and 582:
objective was to minimize the downs
- Page 583 and 584:
more closely represents the largest
- Page 585 and 586:
temperature by forming a thin film
- Page 587 and 588:
such as the one described here. For
- Page 589 and 590:
k is the thermal conductivity of th
- Page 591 and 592:
through finite differences. Mathema
- Page 593 and 594:
Figure 4 Comparison of blade cross-
- Page 595 and 596:
integration of multiple disciplines
- Page 597 and 598:
17. S. S. Talya, ‘‘Multidiscipl
- Page 599 and 600:
INTRODUCTION 10 Rotordynamic Consid
- Page 601 and 602:
Figure 1 (c) AlliedSignal 331 turbo
- Page 603 and 604:
Figure 2 Rotor system displacements
- Page 605 and 606:
Figure 3 Elliptic lateral whirl. av
- Page 607 and 608:
vibration (either forward or backwa
- Page 609 and 610:
Figure 6 The Laval-Jeffcott rotor.
- Page 611 and 612:
are 1808 out of phase (i.e., the be
- Page 613 and 614:
this graph is quite simple; however
- Page 615 and 616:
included on these types of graphs b
- Page 617 and 618:
on the shaft is zero. Thus, the ste
- Page 619 and 620:
are uðtÞ ¼e zeott uo cos ott þ
- Page 621 and 622:
satisfies the inequality O < ot 1
- Page 623 and 624:
Figure 16 Laval-Jeffcott rotor tran
- Page 625 and 626:
Figure 18 Whirl speed map: Laval-Je
- Page 627 and 628:
Figure 20 Laval-Jeffcott rotor: ste
- Page 629 and 630:
Figure 22 Typical precessional mode
- Page 631 and 632:
Figure 24 Examples of flexible disk
- Page 633 and 634:
ackward modes, however, involve con
- Page 635 and 636:
Figure 29 Steady unbalance response
- Page 637 and 638:
assist in attenuating high vibratio
- Page 639 and 640:
properly sizing the damper, a highl
- Page 641 and 642:
Figure 31 Gas turbine schematic and
- Page 643 and 644:
Flexible Disk If the frequency of a
- Page 645 and 646:
motion for each subsegment to form
- Page 647 and 648:
Figure 35 Whirl speed map—straddl
- Page 649 and 650:
Figure 37 Rotor-bearing-support str
- Page 651 and 652:
DESIGN STRATEGIES AND PROCEDURES Ro
- Page 653 and 654:
Figure 38 Straddle mounted rotor. (
- Page 655 and 656:
Figure 39 Unbalance response: strad
- Page 657 and 658:
Figure 40 Double overhung rotor—d
- Page 659 and 660:
earing supports are reduced. The th
- Page 661 and 662:
and also increases the critical spe
- Page 663 and 664:
Examples of structure modes couplin
- Page 665 and 666:
REFERENCES 1. D. Childs, Turbomachi
- Page 667 and 668:
section is intended to place today
- Page 669 and 670:
pressure-fed propellant systems. Hi
- Page 671 and 672:
normally be considered a very small
- Page 673 and 674:
increase of required suction perfor
- Page 675 and 676:
displaced by the F-1 oxidizer pump
- Page 677 and 678:
exposure may be subjected to imping
- Page 679 and 680:
the exhaust duct. Sized to create s
- Page 681 and 682:
excess of 6,000 psi for consumption
- Page 683 and 684:
lifetime. With very few exceptions,
- Page 685 and 686:
using hydrocarbon fuel combustion p
- Page 687 and 688:
can yield noticeable savings in req
- Page 689 and 690:
Figure 3 Rocket engine system schem
- Page 691 and 692:
Figure 6 Staged combustion system,
- Page 693 and 694:
each stage. The term C0 represents
- Page 695 and 696:
Figure 10 Some representative turbo
- Page 697 and 698:
emembered that the second (and any
- Page 699 and 700:
the greatest demands on turbopump p
- Page 701 and 702:
momentum exchange between working f
- Page 703 and 704:
Figure 13 Arrangement of various tu
- Page 705 and 706:
pressure levels. As long as combust
- Page 707 and 708:
Figure 14 Approxmate values of pump
- Page 709 and 710:
liquid rocket engine systems, and e
- Page 711 and 712:
above becomes a factor. This statem
- Page 713 and 714:
We can then state (correctly) that,
- Page 715 and 716:
Figure 15c Typical 2-D centrifugal
- Page 717 and 718:
have seen that the flow rate throug
- Page 719 and 720:
somewhat smaller magnitude of vecto
- Page 721 and 722:
general indicator. Nss will give us
- Page 723 and 724:
U ¼ rotor tangential velocity. By
- Page 725 and 726:
and pump flow derived from the engi
- Page 727 and 728:
In addition to shaft seals, shaft b
- Page 729 and 730:
should be understood that the optim
- Page 731 and 732:
stable operation is assured. In som
- Page 733 and 734:
From Eq. (16) an impeller radial ou
- Page 735 and 736:
Figure 18 Examples of centrifugal p
- Page 737 and 738:
tional to clearance distance) with
- Page 739 and 740:
I would like to conclude this secti
- Page 741 and 742:
generally result in lower pump hydr
- Page 743 and 744:
Figure 15h Cross-section of a typic
- Page 745 and 746:
solutions of Eq. (7) for both stage
- Page 747 and 748:
Figure 15k H-Q characteristics for
- Page 749 and 750:
Figure 15l Typical inducer configur
- Page 751 and 752:
camber) is proportionally lower. Th
- Page 753 and 754:
Figure 22 Single-stage impulse turb
- Page 755 and 756:
the velocity ratio K, but in somewh
- Page 757 and 758:
~V and ~n ¼ fluid velocity and con
- Page 759 and 760:
Fig. 25. The nature of the flow in
- Page 761 and 762:
Although shrouded centrifugal impel
- Page 763 and 764:
is a parasitic device, whose flow r
- Page 765 and 766:
apidly than does the inducer thrust
- Page 767 and 768:
Figure 30 LH2 turbopump rotor mecha
- Page 769 and 770:
eplacement of a failed bearing with
- Page 771 and 772:
shall see, contemporary rocket engi
- Page 773 and 774:
needs of the aircraft gas turbine a
- Page 775 and 776:
was increased due to engine upratin
- Page 777 and 778:
12 Turbomachinery Performance Testi
- Page 779 and 780:
istics. The more accurate the perfo
- Page 781 and 782:
Inlet Distortion Most turbomachiner
- Page 783 and 784:
Gas Thermodynamic Properties Turbom
- Page 785 and 786:
ought to rest isentropically. Total
- Page 787 and 788:
include not only the pressure chang
- Page 789 and 790:
The circumferential placement of th
- Page 791 and 792:
simply arithmetically averaging the
- Page 793 and 794:
usually mounted in radial immersion
- Page 795 and 796:
Figure 12(b) Radial flow angle prof
- Page 797 and 798:
Figure 15 Wake rake total pressure
- Page 799 and 800:
Figure 16 Blade-tip pressure traces
- Page 801 and 802:
Figure 18 Typical test rig schemati
- Page 803 and 804:
INSTRUMENTATION DESIGN CONSIDERATIO
- Page 805 and 806:
Dynamic Pressure. Dynamic pressure
- Page 807 and 808:
thermocouples. With care in constru
- Page 809 and 810:
Figure 24 Typical two-dimensional f
- Page 811 and 812:
Thermocouple lead wires should be i
- Page 813 and 814:
Corrected Flow The flow rates used
- Page 815 and 816:
pressure ratio [15]. It can be calc
- Page 817 and 818:
SYMBOLS A Cross-section area Cd Dis
- Page 819 and 820:
INTRODUCTION 13 Automotive Supercha
- Page 821 and 822:
Figure 2 A Roots-type supercharger
- Page 823 and 824:
The supercharger was in routine use
- Page 825 and 826:
Table 1 Superchargers Versus Turboc
- Page 827 and 828:
1960s, turbocharging was used by US
- Page 829 and 830:
Roots Blower The Roots-type blower
- Page 831 and 832:
speeds. The sound is caused by the
- Page 833 and 834:
Figure 8b How the Ro-charger operat
- Page 835 and 836:
The vanes in many designs are preve
- Page 837 and 838:
Figure 11a Key components of the G-
- Page 839 and 840:
Figure 11c G-Lader supercharger is
- Page 841 and 842:
Figure 12b Schematic of centrifugal
- Page 843 and 844:
Figure 14b Components of the typica
- Page 845 and 846:
Turbine Design The turbine housing
- Page 847 and 848:
inertia of the wheel assembly. Mini
- Page 849 and 850:
Figure 18 (a) Turbocharger compress
- Page 851 and 852:
Theoretically this efficiency is: o
- Page 853 and 854:
The overall turbine efficiency incl
- Page 855 and 856:
adjust the spring force to vary the
- Page 857 and 858:
Figure 22b Two vanes are used to pr
- Page 859 and 860:
However, the temperature has to be
- Page 861 and 862:
air can reduce carbon monoxide and
- Page 863 and 864:
Figure 25 (a) Schematic of the COMP
- Page 865 and 866:
this plus the fact that the exhaust
- Page 867 and 868:
14 Tesla Turbomachinery Warren Rice
- Page 869 and 870:
press at the time of the invention
- Page 871 and 872:
can be made to simplify the equatio
- Page 873 and 874:
comparison of the results of variou
- Page 875 and 876:
y composing them of nested cones ra
- Page 877 and 878:
26. E. Bakke, ‘‘Theoretical and
- Page 879 and 880:
61. M. Piesche, ‘‘Investigation
- Page 881 and 882:
15 Hydraulic Turbines V. Dakshina M
- Page 883 and 884:
Table 1 Variables of Interest in Tu
- Page 885 and 886:
Figure 1 Variation of impeller shap
- Page 887 and 888:
Figure 2 Flow and velocity componen
- Page 889 and 890:
Figure 3 Schematic diagram of Pelto
- Page 891 and 892:
shown in Fig. 5(see KadambiandPrasa
- Page 893 and 894:
classified according to the directi
- Page 895 and 896:
The manufacturers of hydraulic turb
- Page 897 and 898:
The direction of the relative veloc
- Page 899 and 900:
Table 3 Variation of Some Quantitie
- Page 901 and 902:
denoted by hd. Thus the efficiency
- Page 903 and 904:
Figure 14 Draft tube setting. same
- Page 905:
REFERENCES 1. J. J. Fritz, Small an