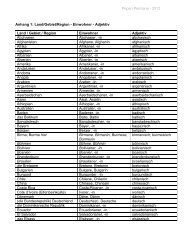
- Page 1 and 2:
FILSAFAT KORUPSI Kata "korupsi" dat
- Page 3 and 4:
o 2.1 Five Hypotheses Concerning th
- Page 5 and 6:
justified by recourse to some princ
- Page 7 and 8:
We can conclude that the various cu
- Page 9 and 10:
pribadi tidak kelembagaan] Korupsi
- Page 11 and 12:
er;ubah, [bukan/tidak] hakim, maupu
- Page 13 and 14:
suatu courtroom [yang] menentukan d
- Page 15 and 16:
pelatihan dewan pejabat pemberlaku
- Page 17 and 18:
and compromised in a corrupt and in
- Page 19 and 20:
corruptor (as we have defined corru
- Page 21 and 22:
to, a large corporation who steal f
- Page 23 and 24:
including the moral characters of t
- Page 25 and 26:
disibukkan dengan suatu tindakan ko
- Page 27 and 28:
penawaran dengan demikian digangsir
- Page 29 and 30:
corruption — although it might se
- Page 31 and 32:
yang ia percaya untuk;menjadi [hak/
- Page 33 and 34:
Abed, George T. and Sanjeev Gupta (
- Page 35 and 36:
case they would occasionally make e
- Page 37 and 38:
analogies lead to bad conclusions,
- Page 39 and 40:
Ini adalah tembolok Google' untuk h
- Page 41 and 42:
Indicates the frequency of attempts
- Page 43 and 44:
Population Public officials . Not e
- Page 45 and 46:
4. Corruption expectations Populati
- Page 47 and 48:
. that it is a successful practice
- Page 49 and 50:
as corruption within international
- Page 51 and 52:
wrath is seen as directed at our ow
- Page 53 and 54:
Publisher: Prentice Hall Copyright:
- Page 55 and 56:
studies, for example, Watergate. In
- Page 57 and 58:
Corruption is widely recognised to
- Page 59 and 60:
Developing Cultural Criminology: Th
- Page 61 and 62:
Paradigms of Power & Persuasion, 1-
- Page 63 and 64:
phenomenon, is it not plausible tha
- Page 65 and 66:
Definition of Institutional Corrupt
- Page 67 and 68:
The third and final thesis to be di
- Page 69 and 70:
A final point about social groups.
- Page 71 and 72:
espect of the moral weight to be at
- Page 73 and 74:
institutional actor in this setting
- Page 75 and 76:
elationship can be overcome or even
- Page 77 and 78:
Related research VI Page 1 The Role
- Page 79 and 80:
esources are embezzled from the sec
- Page 81 and 82:
sentiments and when the rule of sys
- Page 83 and 84:
Publishing Press, Bucharest 1994 (I
- Page 85 and 86:
monitor it) and in a context in whi
- Page 87 and 88:
5 capital have received considerabl
- Page 89 and 90:
Page 7 7 A first is reputation-base
- Page 91 and 92:
trustworthiness. Trustworthy behavi
- Page 93 and 94:
trustworthiness. However, B‘s beh
- Page 95 and 96:
that children feel as a result of p
- Page 97 and 98:
Page 16 16 belief that others are a
- Page 99 and 100:
18 may demand payoffs in return for
- Page 101 and 102:
Firms pay bribes to obtain certaint
- Page 103 and 104:
conflicts of interest have not been
- Page 105 and 106:
of social capital (Putnam, 2000). P
- Page 107 and 108:
such activities, the government sup
- Page 109 and 110:
countries in the region. 32 29 More
- Page 111 and 112:
Communist countries (Inglehart and
- Page 113 and 114:
113 gov-ernment, and tests the hypo
- Page 115 and 116:
115 Page 6 the data, and empiricall
- Page 117 and 118:
tion nets the defector a maximum on
- Page 119 and 120:
viduals having a direct “trade”
- Page 121 and 122:
R 2 − c + K(u + z) + δ 1 − δ
- Page 123 and 124:
in internal disputes. 9 These examp
- Page 125 and 126:
Indian politicians often intervene
- Page 127 and 128:
Propositions 1 and 2 showed how soc
- Page 129 and 130:
are members of different networks,
- Page 131 and 132:
In India, as we have seen, transfer
- Page 133 and 134:
29 7 Empirical Analysis The Data on
- Page 135 and 136:
135 theories might explain why soci
- Page 137 and 138:
137 edastic-consisten t t-statistic
- Page 139 and 140:
139 erage of log of n um b er of co
- Page 141 and 142:
There is strikingly little literatu
- Page 143 and 144:
Underdevelopment (The dotted lines
- Page 145 and 146:
eform and industrial policy. The su
- Page 147 and 148:
147 from his position as vice-presi
- Page 149 and 150:
no incentive to refrain from corrup
- Page 151 and 152:
children‘s schoolteacher, when yo
- Page 153 and 154: international donor organizations p
- Page 155 and 156: 19th Century Sweden - how corruptio
- Page 157 and 158: civil servant to receive income fro
- Page 159 and 160: 159 The first is that "agents are n
- Page 161 and 162: 161 Science Assocition. Rothstein,
- Page 163 and 164: 163 gifts and tributes between loca
- Page 165 and 166: 165 corrupt acts in society. Global
- Page 167 and 168: 167 bring together the media, polit
- Page 169 and 170: Transparency International, Corrupt
- Page 171 and 172: Rutland, Peter and Natasha Kogan. C
- Page 173 and 174: Courts: a Governance-based Approach
- Page 175 and 176: indicators. Yet, it is always possi
- Page 177 and 178: (judges, lawyers, and firms). The S
- Page 179 and 180: same kind of administrative and pro
- Page 181 and 182: at a low expected cost and, therefo
- Page 183 and 184: Impact of Reforms on the Reports of
- Page 185 and 186: 0.192 0.00 REAL INCOME -0.810 -0.58
- Page 187 and 188: community-based institutions in Per
- Page 189 and 190: Berikut ini adalah versi HTML dari
- Page 191 and 192: 191 2)Even the institutional reform
- Page 193 and 194: UNDERPRIVILEGED IN LATIN AMERICA (U
- Page 195 and 196: 20) PATRICK GLYNN , STEPHEN J. KOBR
- Page 197 and 198: connected with a broader sense of f
- Page 199 and 200: trade liberalization; (6) liberaliz
- Page 201 and 202: president the power to enact decree
- Page 203: that create deprivation face little