10. Appendix

You also want an ePaper? Increase the reach of your titles
YUMPU automatically turns print PDFs into web optimized ePapers that Google loves.
A4.1 A Prototypical Deep Center in N-Type Zincblende-Type Semiconductors 679<br />
iments have firmly established that the deep centers induced by pressure in<br />
GaAs have the same properties as the DX center found in AlGaAs and, furthermore,<br />
this conversion of shallow donors to DX centers occurred also for<br />
other group IV donors, such as Ge and Sn, and group VI donors like S, Se<br />
and Te. In fact, it has been shown that the effect of a hydrostatic pressure of<br />
0.1 GPa on the DX in GaAs is almost equivalent to adding 1% of Al [Wei89].<br />
It has been known that both pressure and alloying with Al have the similar<br />
effect of lowering the conduction band minima at the X point of the Brillouin<br />
zone in GaAs relative to the zone-center conduction band valley. With<br />
sufficient pressure or Al concentration GaAs can be converted from a direct<br />
band gap semiconductor into an indirect one. At ambient pressure the DX<br />
level associated with donor atoms in GaAs is actually a resonant state above<br />
the conduction band. As a result of the change in the conduction band structure<br />
caused by alloying or by pressure, the DX level emerges from the conduction<br />
band into the band gap and becomes the stable ground state of the<br />
donor. Thus, one can conclude that the DX center is the result of a so-called<br />
“shallow-to-deep transformation” of substitutional donors in GaAs induced by<br />
changes in the conduction band structure. In this transformation the chemical<br />
nature of the impurity plays only a secondary role.<br />
E (eV)<br />
2.5<br />
2.0<br />
1.5<br />
Al Ga As<br />
x 1-x<br />
1.4<br />
0 0.2 0.4 0.6 0.8 1.0<br />
GaAs AlAs Mole Fraction x AlAs<br />
Γ<br />
L<br />
X<br />
E(eV)=0.54x+1.57<br />
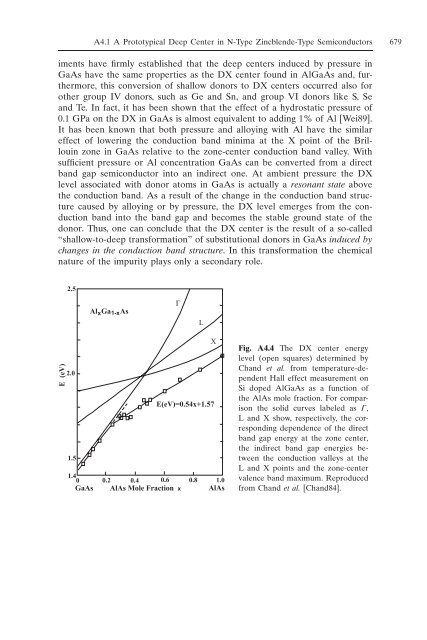
Fig. A4.4 The DX center energy<br />
level (open squares) determined by<br />
Chand et al. from temperature-dependent<br />
Hall effect measurement on<br />
Si doped AlGaAs as a function of<br />
the AlAs mole fraction. For comparison<br />
the solid curves labeled as °,<br />
L and X show, respectively, the corresponding<br />
dependence of the direct<br />
band gap energy at the zone center,<br />
the indirect band gap energies between<br />
the conduction valleys at the<br />
L and X points and the zone-center<br />
valence band maximum. Reproduced<br />
from Chand et al. [Chand84].