The Influence Of Priming Two Cucumber Cultivar Seeds
The Influence Of Priming Two Cucumber Cultivar Seeds
The Influence Of Priming Two Cucumber Cultivar Seeds

You also want an ePaper? Increase the reach of your titles
YUMPU automatically turns print PDFs into web optimized ePapers that Google loves.
J. Duhok Univ. Vol.13, No.1, (Agri. And Vet. Sciences) Pp 36-48, 2010<br />
NAA60ppm Fe (98.23cm³) and 0.2% KNO3<br />
60ppm Fe (98.38cm³). Concerning the<br />
interactions between NAA KNO3 Fe, shows<br />
that the interaction between 5ppm NAA0.2%<br />
KNO360ppm Fe gave the highest value<br />
(102.35cm³) of fruit size, whereas the lowest<br />
value of fruit size (85.37cm³) was observed from<br />
the untreated trees (table 4).<br />
5- Fruit Carbohydrate (%): Table (5) showed<br />
that the fruit Carbohydrate concentration was<br />
increased significantly by increasing the levels<br />
to5ppm NAA, 0.2% KNO3 and 60 ppm Fe. <strong>The</strong><br />
04<br />
interactions of 5ppmNAA 0.2% KNO3, 5ppm<br />
NAA 60ppm Fe or 0.2% KNO3 60ppm Fe had<br />
a significant increase of fruit Carbohydrate<br />
concentration as compared to other interactions.<br />
<strong>The</strong> highest percentage of Carbohydrate<br />
concentration (18.25%) was attained when the<br />
trees received 5ppm NAA 0.2% KNO3 60ppm<br />
Fe, whereas the lowest percentages of<br />
Carbohydrate (11.13%) in fruits was obtained<br />
from trees receiving no NAA, KNO3 or Fe<br />
(control).<br />
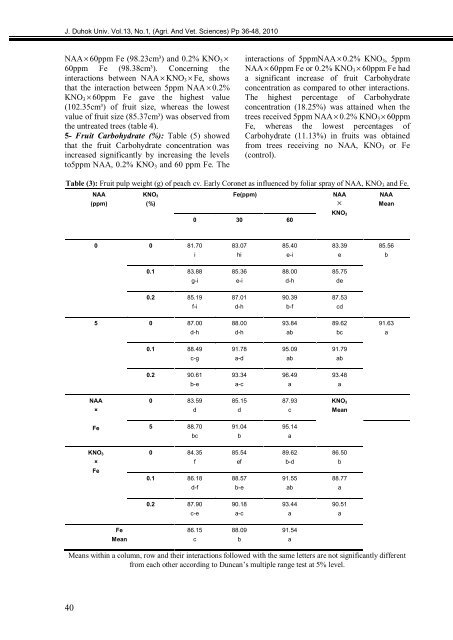
Table (3): Fruit pulp weight (g) of peach cv. Early Coronet as influenced by foliar spray of NAA, KNO3 and Fe.<br />
NAA<br />
(ppm)<br />
KNO3<br />
(%)<br />
0 0 81.70<br />
0.1 83.88<br />
Fe(ppm) NAA<br />
<br />
0 30 60<br />
i<br />
g-i<br />
0.2 85.19<br />
5 0 87.00<br />
NAA<br />
×<br />
Fe<br />
KNO3<br />
×<br />
Fe<br />
Fe<br />
Mean<br />
f-i<br />
d-h<br />
0.1 88.49<br />
c-g<br />
0.2 90.61<br />
b-e<br />
0 83.59<br />
d<br />
5 88.70<br />
bc<br />
0 84.35<br />
0.1 86.18<br />
f<br />
d-f<br />
0.2 87.90<br />
c-e<br />
86.15<br />
c<br />
83.07<br />
hi<br />
85.36<br />
e-i<br />
87.01<br />
d-h<br />
88.00<br />
d-h<br />
91.78<br />
a-d<br />
93.34<br />
a-c<br />
85.15<br />
d<br />
91.04<br />
b<br />
85.54<br />
ef<br />
88.57<br />
b-e<br />
90.18<br />
a-c<br />
88.09<br />
85.40<br />
e-i<br />
88.00<br />
d-h<br />
90.39<br />
b-f<br />
93.84<br />
ab<br />
95.09<br />
ab<br />
96.49<br />
a<br />
87.93<br />
c<br />
95.14<br />
a<br />
89.62<br />
b-d<br />
91.55<br />
ab<br />
KNO3<br />
83.39<br />
e<br />
85.75<br />
de<br />
87.53<br />
cd<br />
89.62<br />
bc<br />
91.79<br />
ab<br />
93.48<br />
a<br />
KNO3<br />
Mean<br />
Means within a column, row and their interactions followed with the same letters are not significantly different<br />
from each other according to Duncan’s multiple range test at 5% level.<br />
b<br />
93.44<br />
a<br />
91.54<br />
a<br />
86.50<br />
b<br />
88.77<br />
a<br />
90.51<br />
a<br />
NAA<br />
Mean<br />
85.56<br />
b<br />
91.63<br />
a