The Influence Of Priming Two Cucumber Cultivar Seeds
The Influence Of Priming Two Cucumber Cultivar Seeds
The Influence Of Priming Two Cucumber Cultivar Seeds

Create successful ePaper yourself
Turn your PDF publications into a flip-book with our unique Google optimized e-Paper software.
J. Duhok Univ. Vol.13, No.1, (Agri. And Vet. Sciences) Pp 82-89, 2010<br />
have advantages and disadvantages, as shown<br />
below. Turbidity is usually measured in<br />
nephelometric turbidity units (NTU) or Jackson<br />
turbidity units (JTLJ), depending on the method<br />
used for measurement. <strong>The</strong> two units roughly<br />
equal (Jamie and Richard, 1996). Although<br />
measuring turbidity is easer than measuring<br />
suspended solid, more information is needed on<br />
their relation. While a relationship can be<br />
established between turbidity and suspended<br />
sediment, this relationship can and will change<br />
spatially and temporally due to variations in<br />
sediment composition and stream energy<br />
(Rasmussen, 1995).<br />
<strong>The</strong> study was started depended on the<br />
collected data of turbid runoff suspended water<br />
samples from Duhok Dam watershed river<br />
before it arrives into the reservoir, after each<br />
heavy rainfall which, cause runoff to ward the<br />
Rainfall data during study period was taken from<br />
Duhok Dam meteorology stations (Table 1). To<br />
prepare the standard curve three mixed samples<br />
of soil were taken from seven different sites<br />
along the Duhok Dam watershed, and the soil<br />
samples approximately represented the condition<br />
of watershed soil.<br />
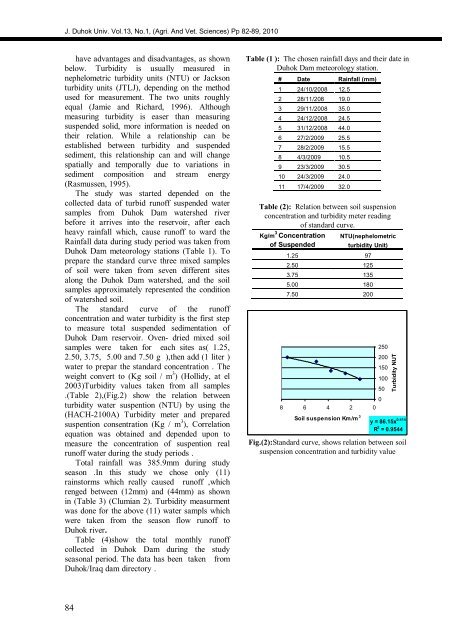
<strong>The</strong> standard curve of the runoff<br />
concentration and water turbidity is the first step<br />
to measure total suspended sedimentation of<br />
Duhok Dam reservoir. Oven- dried mixed soil<br />
samples were taken for each sites as( 1.25,<br />
2.50, 3.75, 5.00 and 7.50 g ),then add (1 liter )<br />
water to prepar the standard concentration . <strong>The</strong><br />
weight convert to (Kg soil / m 3 ) (Hollidy, at el<br />
2003)Turbidity values taken from all samples<br />
.(Table 2),(Fig.2) show the relation between<br />
turbidity water suspention (NTU) by using the<br />
(HACH-2100A) Turbidity meter and prepared<br />
suspention consentration (Kg / m 3 ), Correlation<br />
equation was obtained and depended upon to<br />
measure the concentration of suspention real<br />
runoff water during the study periods .<br />
Total rainfall was 385.9mm during study<br />
season .In this study we chose only (11)<br />
rainstorms which really caused runoff ,which<br />
renged between (12mm) and (44mm) as shown<br />
in (Table 3) (Clumian 2). Turbidity measurment<br />
was done for the above (11) water sampls which<br />
were taken from the season flow runoff to<br />
Duhok river.<br />
Table (4)show the total monthly runoff<br />
collected in Duhok Dam during the study<br />
seasonal period. <strong>The</strong> data has been taken from<br />
Duhok/Iraq dam directory .<br />
28<br />
Table (1 ): <strong>The</strong> chosen rainfall days and their date in<br />
Duhok Dam meteorology station.<br />
# Date Rainfall (mm)<br />
1 24/10/2008 12.5<br />
2 28/11/208 19.0<br />
3 29/11/2008 35.0<br />
4 24/12/2008 24.5<br />
5 31/12/2008 44.0<br />
6 27/2/2009 25.5<br />
7 28/2/2009 15.5<br />
8 4/3/2009 10.5<br />
9 23/3/2009 30.5<br />
10 24/3/2009 24.0<br />
11 17/4/2009 32.0<br />
Table (2): Relation between soil suspension<br />
concentration and turbidity meter reading<br />
of standard curve.<br />
Kg/m 3 Concentration<br />
of Suspended<br />
8<br />
NTU(nephelometric<br />
turbidity Unit)<br />
1.25 97<br />
2.50 125<br />
3.75 135<br />
5.00 180<br />
7.50 200<br />
6<br />
4<br />
Soil suspension Km/m 3<br />
2<br />
50<br />
0<br />
0<br />
250<br />
200<br />
150<br />
100<br />
y = 86.15x 0.414<br />
R 2 = 0.9544<br />
Fig.(2):Standard curve, shows relation between soil<br />
suspension concentration and turbidity value<br />
Turbidity NUT