The Influence Of Priming Two Cucumber Cultivar Seeds
The Influence Of Priming Two Cucumber Cultivar Seeds
The Influence Of Priming Two Cucumber Cultivar Seeds

You also want an ePaper? Increase the reach of your titles
YUMPU automatically turns print PDFs into web optimized ePapers that Google loves.
J. Duhok Univ. Vol.13, No.1, (Agri. And Vet. Sciences) Pp 82-89, 2010<br />
28<br />
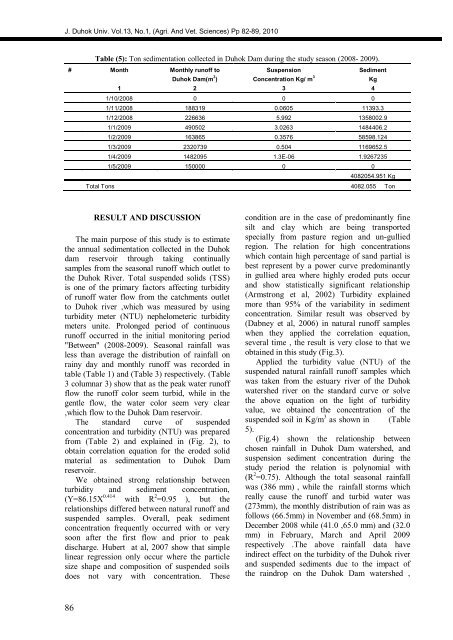
Table (5): Ton sedimentation collected in Duhok Dam during the study season (2008- 2009).<br />
# Month<br />
1<br />
Monthly runoff to<br />
Duhok Dam(m 3 )<br />
1/10/2008 0<br />
1/11/2008 188319<br />
1/12/2008 226636<br />
1/1/2009 490502<br />
1/2/2009 163865<br />
1/3/2009 2320739<br />
1/4/2009 1482095<br />
1/5/2009 150000<br />
2<br />
Suspension<br />
Concentration Kg/ m 3<br />
3<br />
Sediment<br />
Kg<br />
0 0<br />
0.0605 11393.3<br />
5.992 1358002.9<br />
3.0263 1484406.2<br />
0.3576 58598.124<br />
0.504 1169652.5<br />
1.3E-06 1.9267235<br />
0 0<br />
4<br />
4082054.951 Kg<br />
Total Tons 4082.055 Ton<br />
RESULT AND DISCUSSION<br />
<strong>The</strong> main purpose of this study is to estimate<br />
the annual sedimentation collected in the Duhok<br />
dam reservoir through taking continually<br />
samples from the seasonal runoff which outlet to<br />
the Duhok River. Total suspended solids (TSS)<br />
is one of the primary factors affecting turbidity<br />
of runoff water flow from the catchments outlet<br />
to Duhok river ,which was measured by using<br />
turbidity meter (NTU) nephelometeric turbidity<br />
meters unite. Prolonged period of continuous<br />
runoff occurred in the initial monitoring period<br />
"Between" (2008-2009). Seasonal rainfall was<br />
less than average the distribution of rainfall on<br />
rainy day and monthly runoff was recorded in<br />
table (Table 1) and (Table 3) respectively. (Table<br />
3 columnar 3) show that as the peak water runoff<br />
flow the runoff color seem turbid, while in the<br />
gentle flow, the water color seem very clear<br />
,which flow to the Duhok Dam reservoir.<br />
<strong>The</strong> standard curve of suspended<br />
concentration and turbidity (NTU) was prepared<br />
from (Table 2) and explained in (Fig. 8), to<br />
obtain correlation equation for the eroded solid<br />
material as sedimentation to Duhok Dam<br />
reservoir.<br />
We obtained strong relationship between<br />
turbidity and sediment concentration,<br />
(Y=86.15X 0.414 with R 2 =0.95<br />
), but the<br />
relationships differed between natural runoff and<br />
suspended samples. Overall, peak sediment<br />
concentration frequently occurred with or very<br />
soon after the first flow and prior to peak<br />
discharge. Hubert at al, 2007 show that simple<br />
linear regression only occur where the particle<br />
size shape and composition of suspended soils<br />
does not vary with concentration. <strong>The</strong>se<br />
condition are in the case of predominantly fine<br />
silt and clay which are being transported<br />
specially from pasture region and un-gullied<br />
region. <strong>The</strong> relation for high concentrations<br />
which contain high percentage of sand partial is<br />
best represent by a power curve predominantly<br />
in gullied area where highly eroded puts occur<br />
and show statistically significant relationship<br />
(Armstrong et al, 2002) Turbidity explained<br />
more than 95% of the variability in sediment<br />
concentration. Similar result was observed by<br />
(Dabney et al, 2006) in natural runoff samples<br />
when they applied the correlation equation,<br />
several time , the result is very close to that we<br />
obtained in this study (Fig.8).<br />
Applied the turbidity value (NTU) of the<br />
suspended natural rainfall runoff samples which<br />
was taken from the estuary river of the Duhok<br />
watershed river on the standard curve or solve<br />
the above equation on the light of turbidity<br />
value, we obtained the concentration of the<br />
suspended soil in Kg/m 3 as shown in (Table<br />
5).<br />
(Fig.8) shown the relationship between<br />
chosen rainfall in Duhok Dam watershed, and<br />
suspension sediment concentration during the<br />
study period the relation is polynomial with<br />
(R 2 =0.75). Although the total seasonal rainfall<br />
was (386 mm) , while the rainfall storms which<br />
really cause the runoff and turbid water was<br />
(273mm), the monthly distribution of rain was as<br />
follows (66.5mm) in November and (68.5mm) in<br />
December 2008 while (41.0 ,65.0 mm) and (32.0<br />
mm) in February, March and April 2009<br />
respectively .<strong>The</strong> above rainfall data have<br />
indirect effect on the turbidity of the Duhok river<br />
and suspended sediments due to the impact of<br />
the raindrop on the Duhok Dam watershed ,