- Page 1:
MonitorMagic
- Page 4 and 5:
MonitorMagic Reporting - Overview..
- Page 7 and 8:
MonitorMagic Quick Start Guide Welc
- Page 9 and 10:
MonitorMagic Quick Start Guide Wh
- Page 11 and 12:
MonitorMagic Quick Start Guide Rela
- Page 13 and 14:
Release notes MonitorMagic version
- Page 15 and 16:
Release notes monito
- Page 17 and 18:
Release notes Database
- Page 19 and 20:
Release notes Service monitor: Whe
- Page 21 and 22:
Release notes Process monitor: The
- Page 23 and 24:
Release notes See also: Features Mo
- Page 25:
Release notes For E-mail messages
- Page 28 and 29:
MonitorMagic Memory (RAM) 64 MB 128
- Page 30 and 31:
MonitorMagic The name of the domai
- Page 32 and 33:
MonitorMagic Select the domain, pre
- Page 34 and 35:
MonitorMagic The properties window
- Page 36 and 37:
MonitorMagic The tabbed window Conf
- Page 38 and 39:
MonitorMagic Divide W and D by 10
- Page 41 and 42:
Using MonitorMagic Policies, Monito
- Page 43 and 44:
Using MonitorMagic See also: Differ
- Page 45 and 46:
Using MonitorMagic When specifying
- Page 47 and 48:
Using MonitorMagic Create monitors,
- Page 49 and 50:
Using MonitorMagic Ask the user Whe
- Page 51 and 52:
Using MonitorMagic Similarly, you c
- Page 53 and 54:
Using MonitorMagic See also: Polici
- Page 55 and 56:
Using MonitorMagic Once the policy
- Page 57 and 58:
Using MonitorMagic all the rules of
- Page 59 and 60:
Using MonitorMagic See also: Polici
- Page 61 and 62:
Using MonitorMagic Note: If the Mon
- Page 63 and 64:
Using MonitorMagic See also: Specif
- Page 65 and 66:
Using MonitorMagic Ping time-out va
- Page 67 and 68:
Using MonitorMagic Monitor For a mo
- Page 69 and 70:
Using MonitorMagic Use the Specify
- Page 71 and 72:
Using MonitorMagic Cancel Press to
- Page 73 and 74:
Using MonitorMagic Use the Specify
- Page 75 and 76:
Using MonitorMagic Event log advanc
- Page 77 and 78:
Using MonitorMagic Category 2 The c
- Page 79 and 80:
Using MonitorMagic From the window
- Page 81 and 82:
Using MonitorMagic Performance coun
- Page 83 and 84:
Using MonitorMagic See also: Proces
- Page 85 and 86:
Using MonitorMagic warning MonitorM
- Page 87 and 88:
Using MonitorMagic To add a new fil
- Page 89 and 90:
Using MonitorMagic Select this opti
- Page 91 and 92:
Using MonitorMagic The window shows
- Page 93 and 94:
Using MonitorMagic To see the rules
- Page 95 and 96:
Using MonitorMagic any search strin
- Page 97 and 98:
Using MonitorMagic Clusters Cluster
- Page 99 and 100:
Using MonitorMagic You can use this
- Page 101 and 102:
Using MonitorMagic Snmp trap monito
- Page 103 and 104:
Using MonitorMagic Source address E
- Page 105 and 106:
Using MonitorMagic Snmp get monitor
- Page 107 and 108:
Using MonitorMagic The window shows
- Page 109 and 110:
Using MonitorMagic Get All... Press
- Page 111 and 112:
Using MonitorMagic First select the
- Page 113 and 114:
Using MonitorMagic To collect the d
- Page 115 and 116:
Using MonitorMagic Next topic in se
- Page 117 and 118:
Using MonitorMagic Snmp get monitor
- Page 119 and 120:
Using MonitorMagic Data object 7 76
- Page 121 and 122:
Using MonitorMagic The path of the
- Page 123 and 124:
Using MonitorMagic flags Output ana
- Page 125 and 126:
Using MonitorMagic intervals can ov
- Page 127 and 128:
Using MonitorMagic Generate Generat
- Page 129 and 130:
Using MonitorMagic Delayed rule tri
- Page 131 and 132:
Using MonitorMagic Generate rule na
- Page 133 and 134:
Using MonitorMagic See also: Rules
- Page 135 and 136:
Using MonitorMagic See also: Rules
- Page 137 and 138:
Using MonitorMagic Adding a new ala
- Page 139 and 140:
Using MonitorMagic The same window
- Page 141 and 142:
Using MonitorMagic Managing alarm a
- Page 143 and 144:
Using MonitorMagic The E-mail mess
- Page 145 and 146:
Using MonitorMagic To specify the c
- Page 147 and 148:
Using MonitorMagic See also: Polici
- Page 149 and 150:
Using MonitorMagic Select the tab S
- Page 151 and 152:
Using MonitorMagic Managing alarm a
- Page 153 and 154:
Using MonitorMagic See also: Polici
- Page 155 and 156:
Using MonitorMagic SNMP trap When a
- Page 157 and 158:
Using MonitorMagic Start service (a
- Page 159 and 160:
Using MonitorMagic The window conta
- Page 161 and 162:
Using MonitorMagic The list contain
- Page 163 and 164:
Using MonitorMagic ...in XXX second
- Page 165 and 166:
Using MonitorMagic the button. If y
- Page 167 and 168:
Using MonitorMagic Microsoft Excha
- Page 169 and 170:
Using MonitorMagic Terminal Server
- Page 171 and 172:
Using MonitorMagic Event Rules: Se
- Page 173 and 174:
Using MonitorMagic In the menu opti
- Page 175 and 176:
Using MonitorMagic A report profile
- Page 177 and 178:
Using MonitorMagic type of report
- Page 179 and 180:
Using MonitorMagic See also: Report
- Page 181 and 182:
Using MonitorMagic Log actions - Cl
- Page 183 and 184:
Using MonitorMagic Reporting - Gene
- Page 185 and 186:
Using MonitorMagic A Report Variabl
- Page 187 and 188:
Using MonitorMagic Select a name fo
- Page 189 and 190:
Using MonitorMagic Reporting - Item
- Page 191 and 192:
Using MonitorMagic To create a subr
- Page 193 and 194:
Using MonitorMagic Find the picture
- Page 195 and 196:
Using MonitorMagic Reporting - Coll
- Page 197 and 198:
Using MonitorMagic This period vari
- Page 199 and 200:
Using MonitorMagic In the window "r
- Page 201 and 202:
Using MonitorMagic This table will
- Page 203 and 204:
Using MonitorMagic In the database
- Page 205 and 206:
Using MonitorMagic See also: Report
- Page 207 and 208: Using MonitorMagic There are three
- Page 209 and 210: Using MonitorMagic See also: Report
- Page 211 and 212: Using MonitorMagic measured in the
- Page 213 and 214: Using MonitorMagic Distribution of
- Page 215 and 216: Using MonitorMagic See also: Report
- Page 217 and 218: Using MonitorMagic Monitor window A
- Page 219 and 220: Using MonitorMagic Refresh Reload t
- Page 221 and 222: Using MonitorMagic See also: Polici
- Page 223 and 224: Using MonitorMagic Properties If a
- Page 225 and 226: Using MonitorMagic Alarm descriptio
- Page 227 and 228: Using MonitorMagic If you select an
- Page 229 and 230: Using MonitorMagic The list contain
- Page 231 and 232: Using MonitorMagic Use the Add, Del
- Page 233 and 234: Using MonitorMagic Select tab Clien
- Page 235 and 236: Using MonitorMagic From the window
- Page 237 and 238: Using MonitorMagic The window conta
- Page 239 and 240: Using MonitorMagic Graph - Options
- Page 241 and 242: Using MonitorMagic MonitorMagic wil
- Page 243 and 244: Using MonitorMagic The window conta
- Page 245 and 246: Using MonitorMagic Select the item
- Page 247 and 248: Using MonitorMagic Graph - Zoom ope
- Page 249 and 250: Using MonitorMagic Use this window
- Page 251 and 252: Using MonitorMagic See also: Graph
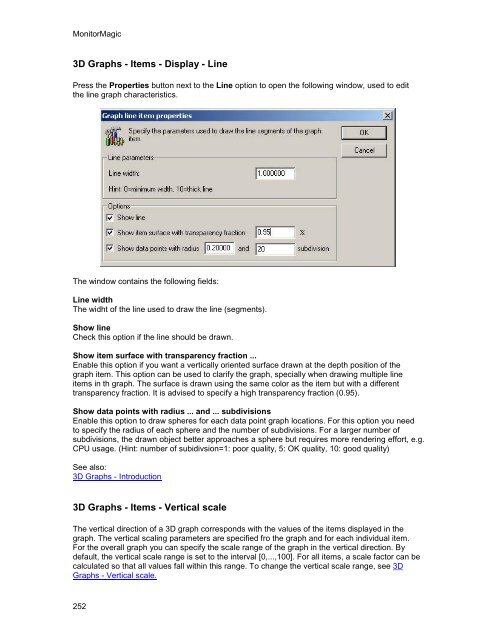
- Page 253 and 254: Using MonitorMagic 3D Graphs - Item
- Page 255 and 256: Using MonitorMagic To change the co
- Page 257: Using MonitorMagic From the window,
- Page 261 and 262: Using MonitorMagic Note: By adjusti
- Page 263 and 264: Using MonitorMagic The MonitorMagic
- Page 265 and 266: Using MonitorMagic The Windows 2000
- Page 267 and 268: Using MonitorMagic Disadvantages M
- Page 269 and 270: Using MonitorMagic Show Start the n
- Page 271 and 272: Using MonitorMagic Checking the ser
- Page 273 and 274: Using MonitorMagic 267
- Page 275 and 276: Using MonitorMagic If you scroll do
- Page 277 and 278: Using MonitorMagic Advanced Monitor
- Page 279 and 280: MonitorMagic topics Configuring the
- Page 281 and 282: MonitorMagic topics Select tab Serv
- Page 283 and 284: MonitorMagic topics Use the Add, Ed
- Page 285 and 286: MonitorMagic topics MonitorMagic SN
- Page 287 and 288: MonitorMagic topics To install the
- Page 289 and 290: MonitorMagic topics Introduction SN
- Page 291 and 292: MonitorMagic topics Valuename: Path
- Page 293 and 294: MonitorMagic topics ObjectOid : 1.3
- Page 295 and 296: MonitorMagic topics As an example,
- Page 297 and 298: MonitorMagic topics The connection
- Page 299 and 300: MonitorMagic topics Introduction to
- Page 301 and 302: MonitorMagic topics Name of the pro
- Page 303 and 304: MonitorMagic topics For troubleshoo
- Page 305 and 306: MonitorMagic topics %number% %messa
- Page 307 and 308: MonitorMagic topics 19; [send] %num
- Page 309 and 310:
MonitorMagic topics Database - Trou
- Page 311 and 312:
MonitorMagic topics OK Database ty
- Page 313 and 314:
MonitorMagic topics Database - Sele
- Page 315 and 316:
MonitorMagic topics The window cont
- Page 317 and 318:
MonitorMagic topics The attribute v
- Page 319 and 320:
MonitorMagic topics If you select a
- Page 321 and 322:
MonitorMagic topics Database - Stop
- Page 323 and 324:
MonitorMagic topics Plugin - T4eSql
- Page 325 and 326:
MonitorMagic topics The T4eSql plug
- Page 327 and 328:
MonitorMagic topics Plugin - T4eSSH
- Page 329 and 330:
MonitorMagic Web Interface Introduc
- Page 331 and 332:
MonitorMagic Web Interface See also
- Page 333 and 334:
MonitorMagic Web Interface MonitorM
- Page 335 and 336:
MonitorMagic Web Interface Configur
- Page 337 and 338:
MonitorMagic Web Interface Once you
- Page 339 and 340:
MonitorMagic Web Interface By click
- Page 341 and 342:
MonitorMagic Web Interface Configur
- Page 343 and 344:
MonitorMagic Web Interface The figu
- Page 345 and 346:
MonitorMagic Web Interface As state
- Page 347 and 348:
MonitorMagic Web Interface to machi
- Page 349 and 350:
MonitorMagic Web Interface Configur
- Page 351 and 352:
MonitorMagic Web Interface yourself
- Page 353 and 354:
MonitorMagic Web Interface Monito
- Page 355 and 356:
MonitorMagic Web Interface As seen
- Page 357 and 358:
MonitorMagic Web Interface the mach
- Page 359 and 360:
MonitorMagic Web Interface Monitors
- Page 361 and 362:
Examples Quick start guide (15 minu
- Page 363 and 364:
Examples The results are shown in
- Page 365 and 366:
FAQ's How can I open the network br
- Page 367:
FAQ's When performance counters are
- Page 370 and 371:
MonitorMagic Scheduler 169 SNMP 106
- Page 372 and 373:
MonitorMagic Build 2195 Uniprocesso
- Page 374 and 375:
MonitorMagic Connects 310 Connects
- Page 376 and 377:
MonitorMagic DNS 26 DNS 58 DNS 59 D
- Page 378 and 379:
MonitorMagic First 119 First Counte
- Page 380 and 381:
MonitorMagic Implementing HTTPS 327
- Page 382 and 383:
MonitorMagic dll 286 Locate 286 Lod
- Page 384 and 385:
MonitorMagic MmLog_EventRecord 204
- Page 386 and 387:
MonitorMagic MonitorMagic 149 Monit
- Page 388 and 389:
MonitorMagic use 332 MonitorMagic W
- Page 390 and 391:
MonitorMagic OK button 313 Only 92
- Page 392 and 393:
MonitorMagic Edit button 113, 114,
- Page 394 and 395:
MonitorMagic Report 355 Report E-ma
- Page 396 and 397:
MonitorMagic Scrollbar 183 Secure 3
- Page 398 and 399:
MonitorMagic defined 95 dll 286 exa
- Page 400 and 401:
MonitorMagic SQL Server ODBC 308 SQ
- Page 402 and 403:
MonitorMagic Test button 120 Test c
- Page 404 and 405:
MonitorMagic Value 155 Value 249 Va