- Page 1 and 2:
Statistical Analysis With Latent Va
- Page 3 and 4:
TABLE OF CONTENTSChapter 1: Introdu
- Page 7 and 8:
IntroductionCHAPTER 1INTRODUCTIONMp
- Page 10:
CHAPTER 1• Regression analysis•
- Page 14 and 15:
CHAPTER 1When there are no covariat
- Page 16 and 17: CHAPTER 1model. For example, variab
- Page 18 and 19: CHAPTER 112
- Page 20 and 21: CHAPTER 2details of the analysis. T
- Page 22 and 23: CHAPTER 2TITLE: this is an example
- Page 24 and 25: CHAPTER 2The Mplus Base and Multile
- Page 26 and 27: CHAPTER 3• Wald chi-square test o
- Page 28 and 29: CHAPTER 3EXAMPLE 3.1: LINEAR REGRES
- Page 30 and 31: CHAPTER 3EXAMPLE 3.3: CENSORED-INFL
- Page 32 and 33: CHAPTER 3example above, u1 is a bin
- Page 34 and 35: CHAPTER 3EXAMPLE 3.8: ZERO-INFLATED
- Page 36 and 37: CHAPTER 3x1yx2sIn this example a re
- Page 38 and 39: CHAPTER 3When two parameters are re
- Page 40 and 41: CHAPTER 3logistic regressions. An e
- Page 42 and 43: CHAPTER 3EXAMPLE 3.15: PATH ANALYSI
- Page 44 and 45: CHAPTER 3The difference between thi
- Page 46 and 47: CHAPTER 3The TECH8 option is used t
- Page 48 and 49: CHAPTER 4CLUSTER, and WEIGHT option
- Page 50 and 51: CHAPTER 4ANALYSIS: TYPE = EFA 1 4;T
- Page 52 and 53: CHAPTER 4EXAMPLE 4.3: EXPLORATORY F
- Page 54 and 55: CHAPTER 4ANALYSIS command is used t
- Page 56 and 57: CHAPTER 4indicators. Rotated soluti
- Page 58 and 59: CHAPTER 5and a set of Poisson or ze
- Page 60 and 61: CHAPTER 5Following is the set of CF
- Page 62 and 63: CHAPTER 5y1f1y2y3y4f2y5y6In this ex
- Page 64 and 65: CHAPTER 5above, all six factor indi
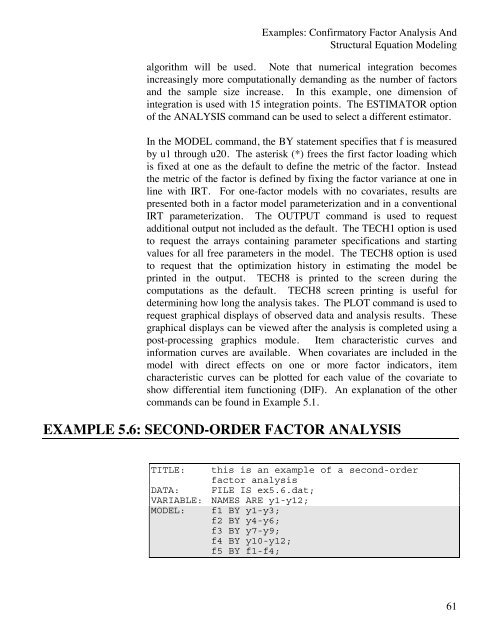
- Page 68 and 69: CHAPTER 5y1 y2 y3 y4y5 y6 y7 y8y9 y
- Page 70 and 71: CHAPTER 5EXAMPLE 5.8: CFA WITH COVA
- Page 72 and 73: CHAPTER 5y1af1y1by1cy2af2y2by2cIn t
- Page 74 and 75: CHAPTER 5that the three test forms
- Page 76 and 77: CHAPTER 5EXAMPLE 5.12: SEM WITH CON
- Page 78 and 79: CHAPTER 5interaction is shown in th
- Page 80 and 81: CHAPTER 5In multiple group analysis
- Page 82 and 83: CHAPTER 5square brackets. When a mo
- Page 84 and 85: CHAPTER 5EXAMPLE 5.18: TWO-GROUP TW
- Page 86 and 87: CHAPTER 5EXAMPLE 5.19: TWO-GROUP TW
- Page 88 and 89: CHAPTER 5EXAMPLE 5.20: CFA WITH PAR
- Page 90 and 91: CHAPTER 5EXAMPLE 5.21: TWO-GROUP TW
- Page 92 and 93: CHAPTER 5unit variance of the laten
- Page 94 and 95: CHAPTER 5EXAMPLE 5.24: EFA WITH COV
- Page 96 and 97: CHAPTER 5y7 y8 y9 y10 y11 y12y1y2f1
- Page 98 and 99: CHAPTER 5y1 y2 y3 y4y5 y6 y7 y8y9 y
- Page 100 and 101: CHAPTER 5In this example, the multi
- Page 102 and 103: CHAPTER 5MODEL: f1-f2 by y1-y10 (*1
- Page 104 and 105: CHAPTER 6slopes are also used to re
- Page 106 and 107: CHAPTER 6for each graphical display
- Page 108 and 109: CHAPTER 6In this example, the linea
- Page 110 and 111: CHAPTER 6be different across time a
- Page 112 and 113: CHAPTER 6name of the censored varia
- Page 114 and 115: CHAPTER 6outcomes with a numerical
- Page 116 and 117:
CHAPTER 6EXAMPLE 6.7: LINEAR GROWTH
- Page 118 and 119:
CHAPTER 6EXAMPLE 6.8: GROWTH MODEL
- Page 120:
CHAPTER 6EXAMPLE 6.10: LINEAR GROWT
- Page 123 and 124:
Examples: Growth Modeling And Survi
- Page 125 and 126:
Examples: Growth Modeling And Survi
- Page 127 and 128:
Examples: Growth Modeling And Survi
- Page 129 and 130:
Examples: Growth Modeling And Survi
- Page 131 and 132:
Examples: Growth Modeling And Survi
- Page 134 and 135:
CHAPTER 6EXAMPLE 6.17: LINEAR GROWT
- Page 136 and 137:
CHAPTER 6y1 y2 y3 y4isx a21 a22 a23
- Page 138 and 139:
CHAPTER 6The GROUPING option is use
- Page 140 and 141:
CHAPTER 6occurred, and a missing va
- Page 142 and 143:
CHAPTER 6In this example, the conti
- Page 144 and 145:
CHAPTER 6intervals plus one. These
- Page 146 and 147:
CHAPTER 6140
- Page 148 and 149:
CHAPTER 7zero-inflated Poisson regr
- Page 150 and 151:
CHAPTER 7Graphical displays of obse
- Page 152 and 153:
CHAPTER 7EXAMPLE 7.1: MIXTURE REGRE
- Page 154 and 155:
CHAPTER 7is to be performed. By sel
- Page 156 and 157:
CHAPTER 7EXAMPLE 7.2: MIXTURE REGRE
- Page 158 and 159:
CHAPTER 7u1u2cu3u4In this example,
- Page 160 and 161:
CHAPTER 7In the MODEL command, user
- Page 162 and 163:
CHAPTER 7The difference between thi
- Page 164 and 165:
CHAPTER 7EXAMPLE 7.9: LCA WITH CONT
- Page 166 and 167:
CHAPTER 7indicators, the default co
- Page 168 and 169:
CHAPTER 7EXAMPLE 7.12: LCA WITH BIN
- Page 170 and 171:
CHAPTER 7The first hypothesis is sp
- Page 172 and 173:
CHAPTER 7The CLASSES option is used
- Page 174 and 175:
CHAPTER 7between the first two vari
- Page 176 and 177:
CHAPTER 7EXAMPLE 7.17: CFA MIXTURE
- Page 178 and 179:
CHAPTER 7u11 u12 u13u21 u22 u23c1c2
- Page 180 and 181:
CHAPTER 7In this example, the model
- Page 182 and 183:
CHAPTER 7EXAMPLE 7.21: MIXTURE MODE
- Page 184 and 185:
CHAPTER 7y1y2cy3y4In this example,
- Page 186 and 187:
CHAPTER 7ycx1x2In this example, the
- Page 188 and 189:
CHAPTER 7MODEL:%OVERALL%y ON x1 x2;
- Page 190 and 191:
CHAPTER 7In this example, the zero-
- Page 192 and 193:
CHAPTER 7EXAMPLE 7.27: FACTOR MIXTU
- Page 194 and 195:
CHAPTER 7EXAMPLE 7.28: TWO-GROUP TW
- Page 196 and 197:
CHAPTER 7algorithm will be used. No
- Page 198 and 199:
CHAPTER 7u11 u12 u13 u14u21 u22 u23
- Page 200 and 201:
CHAPTER 7MODEL:OUTPUT:PLOT:%OVERALL
- Page 202 and 203:
CHAPTER 7196
- Page 204 and 205:
CHAPTER 8All longitudinal mixture m
- Page 206 and 207:
CHAPTER 8• 8.8: GMM with known cl
- Page 208 and 209:
CHAPTER 8to the growth factors i an
- Page 210 and 211:
CHAPTER 8estimated as the default,
- Page 212 and 213:
CHAPTER 8EXAMPLE 8.3: GMM FOR A CEN
- Page 214 and 215:
CHAPTER 8algorithm will be used. No
- Page 216 and 217:
CHAPTER 8by adding to the name of t
- Page 218 and 219:
CHAPTER 8y1 y2 y3 y4isx c uThe diff
- Page 220 and 221:
CHAPTER 8y1 y2 y3 y4 y5 y6 y7 y8i1
- Page 222 and 223:
CHAPTER 8where c2#1 refers to the f
- Page 224 and 225:
CHAPTER 8parts of the model, starti
- Page 226 and 227:
CHAPTER 8The difference between thi
- Page 228 and 229:
CHAPTER 8MODEL c1:MODEL c2:MODEL c3
- Page 230 and 231:
CHAPTER 8u11 u12 u13 u14u21 u22 u23
- Page 232 and 233:
CHAPTER 8MODEL c.c1:%c#1.c1#1%[u11$
- Page 234 and 235:
CHAPTER 8used to select a different
- Page 236 and 237:
CHAPTER 8ALGORITHM=INTEGRATION as i
- Page 238 and 239:
CHAPTER 8ON statement describes the
- Page 240 and 241:
CHAPTER 9VARIABLE command. Observed
- Page 242 and 243:
CHAPTER 9for individual data or the
- Page 244 and 245:
CHAPTER 9• 9.16: Linear growth mo
- Page 246 and 247:
CHAPTER 9TITLE:this is an example o
- Page 248 and 249:
CHAPTER 9Following is the second pa
- Page 250 and 251:
CHAPTER 9xsyWithinwyBetweenxmsThe d
- Page 252 and 253:
CHAPTER 9EXAMPLE 9.3: TWO-LEVEL PAT
- Page 254 and 255:
CHAPTER 9integration are used with
- Page 256 and 257:
CHAPTER 9EXAMPLE 9.5: TWO-LEVEL PAT
- Page 258 and 259:
CHAPTER 9using the ON option. In th
- Page 260 and 261:
CHAPTER 9constrained to be equal ac
- Page 262 and 263:
CHAPTER 9does not require numerical
- Page 264 and 265:
CHAPTER 9In the within part of the
- Page 266 and 267:
CHAPTER 9u1x1fw1u2u3u4x2fw2u5u6With
- Page 268 and 269:
CHAPTER 9In the between part of the
- Page 270 and 271:
CHAPTER 9y1y2fwsy5y3y4Withiny1Betwe
- Page 272 and 273:
CHAPTER 9the factor fb and the clus
- Page 274 and 275:
CHAPTER 9and individuals with g equ
- Page 276 and 277:
CHAPTER 9y1y2y3y4iwswxWithinBetween
- Page 278 and 279:
CHAPTER 9residual variances of the
- Page 280 and 281:
CHAPTER 9EXAMPLE 9.14: TWO-LEVEL GR
- Page 282 and 283:
CHAPTER 9as y1, y2, y3, and y4 in t
- Page 284 and 285:
CHAPTER 9u11u21u31u12 u22 u32 u13 u
- Page 286 and 287:
CHAPTER 9statements are fixed at ze
- Page 288 and 289:
CHAPTER 9timesya3Withinx1yBetweenx2
- Page 290 and 291:
CHAPTER 9EXAMPLE 9.17: TWO-LEVEL GR
- Page 292 and 293:
CHAPTER 9model, the variances of th
- Page 294 and 295:
CHAPTER 9288
- Page 296 and 297:
CHAPTER 10• Complex survey data
- Page 298 and 299:
CHAPTER 10• 10.13: Two-level LTA
- Page 300 and 301:
CHAPTER 10across clusters. The rand
- Page 302 and 303:
CHAPTER 10refers to the part of the
- Page 304 and 305:
CHAPTER 10EXAMPLE 10.2: TWO-LEVEL M
- Page 306 and 307:
CHAPTER 10the end of the arrow poin
- Page 308 and 309:
CHAPTER 10EXAMPLE 10.3: TWO-LEVEL M
- Page 310 and 311:
CHAPTER 10random intercept y is sho
- Page 312 and 313:
CHAPTER 10y1 y2 y3 y4y5cfwWithinBet
- Page 314 and 315:
CHAPTER 10EXAMPLE 10.5: TWO-LEVEL I
- Page 316 and 317:
CHAPTER 10latent variable c. The fi
- Page 318 and 319:
CHAPTER 10u1 u2 u3 u4u5u6cxWithinBe
- Page 320 and 321:
CHAPTER 10EXAMPLE 10.7: TWO-LEVEL L
- Page 322 and 323:
CHAPTER 10In the overall part of th
- Page 324 and 325:
CHAPTER 10y1 y2 y3 y4iwsswxWithinBe
- Page 326 and 327:
CHAPTER 10Following is an alternati
- Page 328 and 329:
CHAPTER 10y1 y2 y3 y4iwswcxWithinBe
- Page 330 and 331:
CHAPTER 10coefficients of the inter
- Page 332 and 333:
CHAPTER 10y1 y2 y3 y4iwswcxWithinBe
- Page 334 and 335:
CHAPTER 10EXAMPLE 10.11: TWO-LEVEL
- Page 336 and 337:
CHAPTER 10In the overall part of th
- Page 338 and 339:
CHAPTER 10In this example, the two-
- Page 340 and 341:
CHAPTER 10u11 u12 u13 u14u21 u22 u2
- Page 342 and 343:
CHAPTER 10336
- Page 344 and 345:
CHAPTER 11With Bayesian analysis, m
- Page 346 and 347:
CHAPTER 11number of parameters and
- Page 348 and 349:
CHAPTER 11EXAMPLE 11.2: DESCRIPTIVE
- Page 350 and 351:
CHAPTER 11MODEL:OUTPUT:i s | y0@0 y
- Page 352 and 353:
CHAPTER 11y0 y1 y2 y3 y4 y5i s qd1
- Page 354 and 355:
CHAPTER 11analysis. In the second p
- Page 356 and 357:
CHAPTER 11DATA IMPUTATION:NDATASETS
- Page 358 and 359:
CHAPTER 11MODEL: %WITHIN%f1w BY u11
- Page 360 and 361:
CHAPTER 11TITLE:DATA:this is an exa
- Page 362 and 363:
CHAPTER 11The ANALYSIS command is u
- Page 364 and 365:
CHAPTER 12saved in an external file
- Page 366 and 367:
CHAPTER 12• 12.11: Monte Carlo si
- Page 368 and 369:
CHAPTER 12MONTE CARLO OUTPUTChi-Squ
- Page 370 and 371:
CHAPTER 12The column labeled Popula
- Page 372 and 373:
CHAPTER 12In this example, data are
- Page 374 and 375:
CHAPTER 12covariances of the indepe
- Page 376 and 377:
CHAPTER 12slope factor s. The binar
- Page 378 and 379:
CHAPTER 12ANALYSIS: TYPE = MIXTURE;
- Page 380 and 381:
CHAPTER 12MODEL MISSING:[y1-y4@-1];
- Page 382 and 383:
CHAPTER 12The default estimator for
- Page 384 and 385:
CHAPTER 12EXAMPLE 12.6 STEP 2: EXTE
- Page 386 and 387:
CHAPTER 12EXAMPLE 12.7 STEP 2: MONT
- Page 388 and 389:
CHAPTER 12MODEL MISSING command spe
- Page 390 and 391:
CHAPTER 12MODEL:OUTPUT:iu su | u1@0
- Page 392 and 393:
CHAPTER 12continuous-time survival
- Page 394 and 395:
CHAPTER 12MODEL:%WITHIN%c | y ON x;
- Page 396 and 397:
CHAPTER 12invariance across groups
- Page 398 and 399:
CHAPTER 13EXAMPLE 13.1: A COVARIANC
- Page 400 and 401:
CHAPTER 13EXAMPLE 13.4: NON-NUMERIC
- Page 402 and 403:
CHAPTER 13EXAMPLE 13.7: TRANSFORMIN
- Page 404 and 405:
CHAPTER 13EXAMPLE 13.10: EQUALITIES
- Page 406 and 407:
CHAPTER 13TITLE: this is an example
- Page 408 and 409:
CHAPTER 13EXAMPLE 13.14: SAVING DAT
- Page 410 and 411:
CHAPTER 13EXAMPLE 13.17: MERGING DA
- Page 412 and 413:
CHAPTER 13EXAMPLE 13.19: GENERATING
- Page 414 and 415:
CHAPTER 14• User-specified starti
- Page 416 and 417:
CHAPTER 14conjunction with the | sy
- Page 418 and 419:
CHAPTER 14Loadings for indicators o
- Page 420 and 421:
CHAPTER 14possible that a local sol
- Page 422 and 423:
CHAPTER 14GENERAL CONVERGENCE PROBL
- Page 424 and 425:
CHAPTER 14Model identification can
- Page 426 and 427:
CHAPTER 14computations will become
- Page 428 and 429:
CHAPTER 14covariances and regressio
- Page 430 and 431:
CHAPTER 14MODEL COMMAND IN MULTIPLE
- Page 432 and 433:
CHAPTER 14in the other two groups.
- Page 434 and 435:
CHAPTER 14MODEL g2: y1-y5 (2);MODEL
- Page 436 and 437:
CHAPTER 14variances in a model with
- Page 438 and 439:
CHAPTER 1432 32 2 32 2 2 3where the
- Page 440 and 441:
CHAPTER 14WEIGHTED LEAST SQUARES ES
- Page 442 and 443:
CHAPTER 14Multiple data sets genera
- Page 444 and 445:
CHAPTER 14Observation Cohort HD82 H
- Page 446 and 447:
CHAPTER 14CALCULATING PROBABILITIES
- Page 448 and 449:
CHAPTER 14log odds (x 0 +1) = a + b
- Page 450 and 451:
CHAPTER 14values are exponentiated
- Page 452 and 453:
CHAPTER 14available for these model
- Page 454 and 455:
CHAPTER 14The joint probabilities f
- Page 456 and 457:
CHAPTER 15THE DATA COMMANDThe DATA
- Page 458 and 459:
CHAPTER 15DATA LONGTOWIDE:LONG =WID
- Page 460 and 461:
CHAPTER 15to the number of variable
- Page 462 and 463:
CHAPTER 15TYPEThe TYPE option is us
- Page 464 and 465:
CHAPTER 15and saved using another c
- Page 466 and 467:
CHAPTER 15LISTWISE = ON;SWMATRIXThe
- Page 468 and 469:
CHAPTER 15parentheses following its
- Page 470 and 471:
CHAPTER 15uses a model of unrestric
- Page 472 and 473:
CHAPTER 15WIDEThe WIDE option is us
- Page 474 and 475:
CHAPTER 15LONG = y | x;where y and
- Page 476 and 477:
CHAPTER 15categorical using the CAT
- Page 478 and 479:
CHAPTER 15THE DATA MISSING COMMANDT
- Page 480 and 481:
CHAPTER 153. The value zero is assi
- Page 482 and 483:
CHAPTER 15NAMESThe NAMES option ide
- Page 484 and 485:
CHAPTER 15cohort. In the example ab
- Page 486 and 487:
CHAPTER 15THE VARIABLE COMMANDVARIA
- Page 488 and 489:
CHAPTER 15ASSIGNING NAMES TO VARIAB
- Page 490 and 491:
CHAPTER 15The USEVARIABLES option i
- Page 492 and 493:
CHAPTER 15MISSING ARE ethnic (9 99)
- Page 494 and 495:
CHAPTER 15CATEGORICALThe CATEGORICA
- Page 496 and 497:
CHAPTER 15where the set of variable
- Page 498 and 499:
CHAPTER 15COUNT = u1-u4 (p);The COU
- Page 500 and 501:
CHAPTER 15GROUPINGThe GROUPING opti
- Page 502 and 503:
CHAPTER 15TSCORESThe TSCORES option
- Page 504 and 505:
CHAPTER 15parentheses is placed beh
- Page 506 and 507:
CHAPTER 15the VARIABLE command and
- Page 508 and 509:
CHAPTER 15WTSCALEThe WTSCALE option
- Page 510 and 511:
CHAPTER 15ANALYSIS command. The sam
- Page 512 and 513:
CHAPTER 15MIXTURE MODELSThere are t
- Page 514 and 515:
CHAPTER 15Fractional values can be
- Page 516 and 517:
CHAPTER 15CONTINUOUS-TIME SURVIVAL
- Page 518 and 519:
CHAPTER 15THE DEFINE COMMANDDEFINE:
- Page 520 and 521:
CHAPTER 15The _MISSING keyword can
- Page 522 and 523:
CHAPTER 15where the variable ymean
- Page 524 and 525:
CHAPTER 15518
- Page 526 and 527:
CHAPTER 16WLS;WLSM;WLSMV;ULS;ULSMV;
- Page 528 and 529:
CHAPTER 16STSCALE = random start sc
- Page 530 and 531:
CHAPTER 16The ANALYSIS command is n
- Page 532 and 533:
CHAPTER 16TYPE = GENERAL RANDOM;or
- Page 534 and 535:
CHAPTER 16• COMPLEX computes stan
- Page 536 and 537:
CHAPTER 16where the first two numbe
- Page 538 and 539:
CHAPTER 16TWOLEVELMUML***ML**MLR**M
- Page 540 and 541:
CHAPTER 16BAYESIAN ESTIMATIONBayesi
- Page 542 and 543:
CHAPTER 16LOGIT REGRESSION VERSUS L
- Page 544 and 545:
CHAPTER 16where .5 is the value of
- Page 546 and 547:
CHAPTER 16ROTATION = TARGET (ORTHOG
- Page 548 and 549:
CHAPTER 16For the FAY resampling me
- Page 550 and 551:
CHAPTER 16OPTIONS RELATED TO NUMERI
- Page 552 and 553:
CHAPTER 16For other outcome types a
- Page 554 and 555:
CHAPTER 16BOOTSTRAPThe BOOTSTRAP op
- Page 556 and 557:
CHAPTER 16values produced by the pr
- Page 558 and 559:
CHAPTER 16OPTSEEDThe OPTSEED option
- Page 560 and 561:
CHAPTER 16DIFFTEST = deriv.dat;wher
- Page 562 and 563:
CHAPTER 16RITERATIONSThe RITERATION
- Page 564 and 565:
CHAPTER 16MIXUThe MIXU option is us
- Page 566 and 567:
CHAPTER 16With multiple chains, par
- Page 568 and 569:
CHAPTER 16such that convergence is
- Page 570 and 571:
CHAPTER 16skipped. A setting of 1 s
- Page 572 and 573:
CHAPTER 16566
- Page 574 and 575:
CHAPTER 17DEPENDENT OR INDEPENDENT
- Page 576 and 577:
CHAPTER 17| names and defines rando
- Page 578 and 579:
CHAPTER 17short for measured by. ON
- Page 580 and 581:
CHAPTER 17because BY statements are
- Page 582 and 583:
CHAPTER 17allowed with TYPE=GENERAL
- Page 584 and 585:
CHAPTER 172001). The target factor
- Page 586 and 587:
CHAPTER 17specifies that regression
- Page 588 and 589:
CHAPTER 17PON, the number of variab
- Page 590 and 591:
CHAPTER 17impliesy1 WITH y4;y1 WITH
- Page 592 and 593:
CHAPTER 17refers to the means of va
- Page 594 and 595:
CHAPTER 17f1 ON x1 x2 x3;f2 ON x1 x
- Page 596 and 597:
CHAPTER 17By placing an asterisk (*
- Page 598 and 599:
CHAPTER 17possible thresholds, thre
- Page 600 and 601:
CHAPTER 17A list of equality constr
- Page 602 and 603:
CHAPTER 17parameters. Following is
- Page 604 and 605:
CHAPTER 17Although y5 is assigned a
- Page 606 and 607:
CHAPTER 17LABELING CLASSES OF A CAT
- Page 608 and 609:
CHAPTER 17[y1-y4@0 i s q];If the |
- Page 610 and 611:
CHAPTER 17Linear for acount outcome
- Page 612 and 613:
CHAPTER 17MultilevelMultipleindicat
- Page 614 and 615:
CHAPTER 17In mixture models for con
- Page 616 and 617:
CHAPTER 17ATThe AT option is used w
- Page 618 and 619:
CHAPTER 17Numerical integration bec
- Page 620 and 621:
CHAPTER 17INDThe variable on the le
- Page 622 and 623:
CHAPTER 17PARAMETERS LABELLED IN TH
- Page 624 and 625:
CHAPTER 17right-hand side of one or
- Page 626 and 627:
CHAPTER 17Type of Parameter Distrib
- Page 628 and 629:
CHAPTER 17number gives the number o
- Page 630 and 631:
CHAPTER 17These are used to specify
- Page 632 and 633:
CHAPTER 17so on. In mixture modelin
- Page 634 and 635:
CHAPTER 17In mixture modeling, the
- Page 636 and 637:
CHAPTER 17A dependent variable that
- Page 638 and 639:
CHAPTER 17632
- Page 640 and 641:
CHAPTER 18CINTERVAL;CINTERVAL (SYMM
- Page 642 and 643:
CHAPTER 18Following is the summary
- Page 644 and 645:
CHAPTER 18and thresholds are found
- Page 646 and 647:
CHAPTER 18printed is too large to f
- Page 648 and 649:
CHAPTER 18where b is the unstandard
- Page 650 and 651:
CHAPTER 18the third column. When st
- Page 652 and 653:
CHAPTER 18When model modification i
- Page 654 and 655:
CHAPTER 18CONFIDENCE INTERVALS OF M
- Page 656 and 657:
CHAPTER 18NOSERROR;This option is n
- Page 658 and 659:
CHAPTER 18FACTOR DETERMINACIESTECHN
- Page 660 and 661:
CHAPTER 18THETAY1 Y2 Y3 Y4 X_______
- Page 662 and 663:
CHAPTER 18TECHNICAL 4 OUTPUTTECH4Th
- Page 664 and 665:
CHAPTER 18model with one less class
- Page 666 and 667:
CHAPTER 18of draws varies from 2 to
- Page 668 and 669:
CHAPTER 18GAMMAThe gamma matrix con
- Page 670 and 671:
CHAPTER 18• Analysis data• Samp
- Page 672 and 673:
CHAPTER 18by the program, the recod
- Page 674 and 675:
CHAPTER 18SIGBETWEENThe SIGBETWEEN
- Page 676 and 677:
CHAPTER 18using the POPULATION and/
- Page 678 and 679:
CHAPTER 18SURVIVAL option. Followin
- Page 680 and 681:
CHAPTER 18FSCORESWhen SAVE=FSCORES
- Page 682 and 683:
CHAPTER 18COOKSWhen SAVE=COOKS is u
- Page 684 and 685:
CHAPTER 18For data in fixed format,
- Page 686 and 687:
CHAPTER 18• Sample proportions•
- Page 688 and 689:
CHAPTER 18Following is an example o
- Page 690 and 691:
CHAPTER 18VIEWING GRAPHICAL OUTPUTS
- Page 692 and 693:
CHAPTER 18Following is the window t
- Page 694 and 695:
CHAPTER 18The plots can be exported
- Page 696 and 697:
CHAPTER 19CLASSES =SURVIVAL =TSCORE
- Page 698 and 699:
CHAPTER 19For Monte Carlo studies,
- Page 700 and 701:
CHAPTER 19binomial model. The lette
- Page 702 and 703:
CHAPTER 19where c1, c2, and c3 are
- Page 704 and 705:
CHAPTER 19together to generate miss
- Page 706 and 707:
CHAPTER 19between dependent and ind
- Page 708 and 709:
CHAPTER 19categories are referred t
- Page 710 and 711:
CHAPTER 19Following is the specific
- Page 712 and 713:
CHAPTER 19TSCORESThe TSCORES option
- Page 714 and 715:
CHAPTER 19where estimates.dat is a
- Page 716 and 717:
CHAPTER 19710
- Page 718 and 719:
CHAPTER 20DATA IMPUTATION:IMPUTE =N
- Page 720 and 721:
CHAPTER 20TSCORES AREnames of obser
- Page 722 and 723:
CHAPTER 20ESTIMATOR = ML; depends o
- Page 724 and 725:
CHAPTER 20STCONVERGENCE = initial s
- Page 726 and 727:
CHAPTER 20INTERACTIVE =PROCESSORS =
- Page 728 and 729:
CHAPTER 20MODEL COVERAGE:%WITHIN%%B
- Page 730 and 731:
CHAPTER 20TYPE IS COVARIANCE; varie
- Page 732 and 733:
CHAPTER 20COVERAGE =STARTING =REPSA
- Page 734 and 735:
Asparouhov, T. & Muthén, B. (2009a
- Page 736 and 737:
Hagenaars, J.A. & McCutcheon, A.L.
- Page 738 and 739:
Larsen, K. (2005). The Cox proporti
- Page 740 and 741:
Muthén, B. (2002). Beyond SEM: Gen
- Page 742 and 743:
Qu, Y., Tan, M., & Kutner, M.H. (19
- Page 744 and 745:
738
- Page 746 and 747:
CATEGORICALMonte Carlo, 701real dat
- Page 748 and 749:
SEM with EFA and CFA factors, 89-91
- Page 750 and 751:
inary outcome, 218-19three-category
- Page 752 and 753:
two-level growth mixture model (GMM
- Page 754 and 755:
PRIORS, 507-8PROBABILITIES, 507-8pr
- Page 756 and 757:
TIMEMEASURES, 478-79time-to-event v
- Page 758:
MUTHÉN & MUTHÉNMplus SINGLE-USER


