Montagne, 1992) or Rim<strong>in</strong>i, <strong>in</strong> Italy, but English disc-jockeys were the ones who madeit popular. Nowadays, it is a movement with a great success <strong>in</strong> Great Brita<strong>in</strong>, Germany,Holl<strong>and</strong>…. In the places where there is a tradition <strong>of</strong> this k<strong>in</strong>d <strong>of</strong> music, they divide thismovement <strong>in</strong>to two subgroups: hardcore <strong>and</strong> mellow.On the Dutch sample we f<strong>in</strong>d a high percentage <strong>of</strong> people who like “mellow-house”<strong>and</strong> a low percentage <strong>of</strong> people who like “hardcore”. This fact is related ma<strong>in</strong>ly tosampl<strong>in</strong>g <strong>and</strong> represent a difference with the other countries. There are also significantdifferences between countries concern<strong>in</strong>g “hip-hop”, “rap”, among others. We do notknow if these differences correspond to different musical preferences <strong>in</strong> each country,to different used names or to sampl<strong>in</strong>g.There is an especial relationship <strong>in</strong> this study between every type <strong>of</strong> music <strong>and</strong> theuse <strong>of</strong> <strong>ecstasy</strong>. With the house music there is always a higher proportion <strong>of</strong> <strong>ecstasy</strong>consumers. But with rock music, pop, salsa <strong>and</strong> melodic music the proportion are<strong>in</strong>verted. Punk music <strong>in</strong> all the samples, with the exception <strong>of</strong> the Dutch one, relatesalso with the use <strong>of</strong> <strong>ecstasy</strong>. Some <strong>of</strong> the less popular music are sometimes associatedwith the use <strong>of</strong> <strong>ecstasy</strong> <strong>in</strong> some <strong>of</strong> the towns: that is the case <strong>of</strong> reggae <strong>in</strong> Palma deMallorca, Modena <strong>and</strong> Utrecht, Hip-hop <strong>in</strong> Coimbra <strong>and</strong> Palma de Mallorca <strong>and</strong> funky<strong>in</strong> Palma de Mallorca <strong>and</strong> Utrecht.RELATIONSHIP WITH PARENTS (% on global sample)COIMBRA MODENA NICE PALMA UTRECHTVery good 15,5 22,1 43,1 25,4 28,0Good 31,3 54,8 35,0 46,7 46,3Not good/Not bad 49,6 15,4 14,1 24,0 21,3Bad 03,6 04,5 04,2 02,7 03,6Very Bad 00,0 03,2 03,6 01,2 00,8In all the cities the relationship between the <strong>in</strong>terviewees <strong>and</strong> their parents isnormally good or very good. Coimbra is a especial case: although there is a highpercentage <strong>of</strong> <strong>in</strong>dividuals who consider their relationship with them “no good, no bad”,it is also the only sample with 0 <strong>in</strong>dividuals who believe their relations with theirparents are “very bad”. These data confirms we are <strong>in</strong> front <strong>of</strong> a population that can notbe described as marg<strong>in</strong>al.This question have preventive implications, because as we know the family can be avery effective preventive tool. The relationship between the youngster <strong>and</strong> their familyis very good <strong>and</strong> furthermore <strong>in</strong> some countries (especially Spa<strong>in</strong>, Italy <strong>and</strong> Portugal)people depends at many levels on their families. Family prevention should be acommoner strategy.56
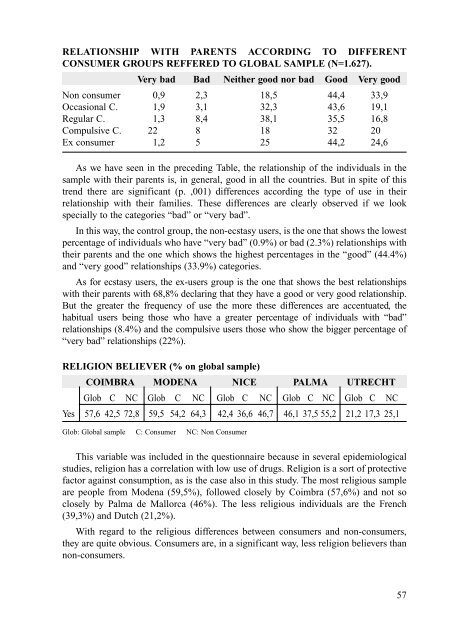
RELATIONSHIP WITH PARENTS ACCORDING TO DIFFERENTCONSUMER GROUPS REFFERED TO GLOBAL SAMPLE (N=1.627).Very bad Bad Neither good nor bad Good Very goodNon consumer 00,9 2,3 18,5 44,4 33,9Occasional C. 01,9 3,1 32,3 43,6 19,1Regular C. 01,3 8,4 38,1 35,5 16,8Compulsive C. 22,0 8,0 18,0 32,0 20,0Ex consumer 01,2 5,0 25,0 44,2 24,6As we have seen <strong>in</strong> the preced<strong>in</strong>g Table, the relationship <strong>of</strong> the <strong>in</strong>dividuals <strong>in</strong> thesample with their parents is, <strong>in</strong> general, good <strong>in</strong> all the countries. But <strong>in</strong> spite <strong>of</strong> thistrend there are significant (p. ,001) differences accord<strong>in</strong>g the type <strong>of</strong> use <strong>in</strong> theirrelationship with their families. These differences are clearly observed if we lookspecially to the categories “bad” or “very bad”.In this way, the control group, the non-<strong>ecstasy</strong> users, is the one that shows the lowestpercentage <strong>of</strong> <strong>in</strong>dividuals who have “very bad” (0.9%) or bad (2.3%) relationships withtheir parents <strong>and</strong> the one which shows the highest percentages <strong>in</strong> the “good” (44.4%)<strong>and</strong> “very good” relationships (33.9%) categories.As for <strong>ecstasy</strong> users, the ex-users group is the one that shows the best relationshipswith their parents with 68,8% declar<strong>in</strong>g that they have a good or very good relationship.But the greater the frequency <strong>of</strong> use the more these differences are accentuated, thehabitual users be<strong>in</strong>g those who have a greater percentage <strong>of</strong> <strong>in</strong>dividuals with “bad”relationships (8.4%) <strong>and</strong> the compulsive users those who show the bigger percentage <strong>of</strong>“very bad” relationships (22%).RELIGION BELIEVER (% on global sample)COIMBRA MODENA NICE PALMA UTRECHTGlob C NC Glob C NC Glob C NC Glob C NC Glob C NCYes 57,6 42,5 72,8 59,5 54,2 64,3 42,4 36,6 46,7 46,1 37,5 55,2 21,2 17,3 25,1Glob: Global sample C: Consumer NC: Non ConsumerThis variable was <strong>in</strong>cluded <strong>in</strong> the questionnaire because <strong>in</strong> several epidemiologicalstudies, religion has a correlation with low use <strong>of</strong> drugs. Religion is a sort <strong>of</strong> protectivefactor aga<strong>in</strong>st consumption, as is the case also <strong>in</strong> this study. The most religious sampleare people from Modena (59,5%), followed closely by Coimbra (57,6%) <strong>and</strong> not soclosely by Palma de Mallorca (46%). The less religious <strong>in</strong>dividuals are the French(39,3%) <strong>and</strong> Dutch (21,2%).With regard to the religious differences between consumers <strong>and</strong> non-consumers,they are quite obvious. Consumers are, <strong>in</strong> a significant way, less religion believers thannon-consumers.57
- Page 3 and 4: ORGANISATIONS AND NATIONAL RESEARCH
- Page 5 and 6: This volume is dedicated very speci
- Page 7 and 8: PRESENTATIONIt’s a great pleasure
- Page 9 and 10: INDEXPág.1. INTRODUCTION . . . . .
- Page 11 and 12: 1. INTRODUCTION1.1. DESIGNER DRUGS,
- Page 13: the most widely used because its ef
- Page 16 and 17: All this led to the famous English
- Page 18 and 19: had used it in the preceding month.
- Page 20 and 21: had used ecstasy or a similar subst
- Page 22 and 23: school population found a prevalenc
- Page 24 and 25: isk factors among adolescents (Cala
- Page 26 and 27: make quantitative what is qualitati
- Page 28 and 29: concentrated in ecstasy use. A stud
- Page 30 and 31: the others versions but with less i
- Page 33 and 34: 3. SAMPLE DESIGN AND FIELD WORK3.1.
- Page 35 and 36: Two different methods were suggeste
- Page 37 and 38: according to drug use level. Finall
- Page 39 and 40: We came into contact with eight ind
- Page 41 and 42: 4. SOCIODEMOGRAPHIC BACKGROUNDINTRO
- Page 43 and 44: We did not think it would be necess
- Page 45 and 46: STUDY LEVEL (% on global sample; %
- Page 47 and 48: In Utrecht, most of the young peopl
- Page 49: SUMMARYWe remind again that, in spi
- Page 52 and 53: This classification will be used fr
- Page 56 and 57: RELIGION PRACTITIONER (% on global
- Page 58 and 59: It stands out the high percentage o
- Page 60 and 61: Amphetamines are often used with fr
- Page 62 and 63: In the Utrecht sample, however, alt
- Page 64 and 65: GLOBAL SAMPLE ANSWERSThe most popul
- Page 66 and 67: These data are interesting in order
- Page 68 and 69: WITH WHOM TO CONSUME ECSTASY? (In %
- Page 70 and 71: As we have already seen in other ta
- Page 73 and 74: 6. SENSATION SEEKING SCALE (SSS)6.1
- Page 75 and 76: correlation’s varies in function
- Page 77 and 78: consumers sample comprises individu
- Page 79 and 80: DISINHIBITION (DIS)Modena, Palma an
- Page 81 and 82: y the non-consumer groups. In addit
- Page 83 and 84: Once again, on the Boredom Suscepti
- Page 85: this new scale. The individuals bel
- Page 88 and 89: Still following psychoanalysis, Koh
- Page 90 and 91: seeking scale, the hypotheses for t
- Page 92 and 93: SDS results according to sexSexPunc
- Page 94 and 95: understanding and explaining realit
- Page 96 and 97: there would be two more or less dif
- Page 98 and 99: RELATION BETWEEN ECSTASY AND SEXThe
- Page 100 and 101: of medicaments. In fact, they are p
- Page 102 and 103: In any case, it is true indeed that
- Page 104 and 105:
Well aware that these interpretatio
- Page 106 and 107:
with others, facilitates being able
- Page 108 and 109:
8.3.2. Social Representation in the
- Page 110 and 111:
with problems”, “the problem wi
- Page 112 and 113:
feel good”, “it causes euphoria
- Page 114 and 115:
Therefore, and taking into account
- Page 116 and 117:
appear in the diagram, as they have
- Page 118 and 119:
as one of the reasons for taking ec
- Page 120 and 121:
In the C diagram we see distributio
- Page 122 and 123:
shy people” and “escape from re
- Page 124 and 125:
We believe the adequate way of inte
- Page 126 and 127:
In the C group there are five compo
- Page 128 and 129:
ecause ecstasy use is connected wit
- Page 130 and 131:
Nowadays, three studies are being c
- Page 132 and 133:
can become addictive conducts and h
- Page 134 and 135:
therapeutic virtues that have been
- Page 136 and 137:
CESDIP/CNRS, Centre d’Etudes et d
- Page 138 and 139:
The Interior Ministry considers tha
- Page 140 and 141:
In spite of the methodological limi
- Page 142 and 143:
directed at investigating the quali
- Page 144 and 145:
follows; 60 % hash/marihuana, 11% e
- Page 146 and 147:
The results highlighted that respon
- Page 148 and 149:
young people interviewed considered
- Page 150 and 151:
In the last few years, however, in
- Page 152 and 153:
04) Ensuring that water is availabl
- Page 154 and 155:
♦ Zini G., Indagine sul consumo d
- Page 156 and 157:
Ossebaard, H.C. (1996). Drugspreven
- Page 158 and 159:
From the secondary school populatio
- Page 160 and 161:
Huizer, H. (1996). Rapport over het
- Page 162 and 163:
A related theme is to describe toda
- Page 164 and 165:
Verhulst, J. (1996). XTC kan altijd
- Page 166 and 167:
Because this review is meant to giv
- Page 168 and 169:
170Mudde, L. (1997). ‘XTC is nog
- Page 170 and 171:
2) The second research was carried
- Page 172 and 173:
Even so it is possible to make a di
- Page 174 and 175:
At the round table of social Analys
- Page 176 and 177:
2. Press articles regarding ecstasy
- Page 178 and 179:
Comas Arnau D, Velázquez Andrés J
- Page 180 and 181:
182estimulantes. p. 111-29.Salazar
- Page 182 and 183:
to the middle and upper classes. Th
- Page 184 and 185:
The culturally sensitive poly-consu
- Page 186 and 187:
SOCIAL REPRESENTATIONS OF CONSUMERS
- Page 188 and 189:
stereotype, there was also the mess
- Page 190 and 191:
their habitual environment, without
- Page 192 and 193:
experiment with drugs such as heroi
- Page 194 and 195:
This policy is being received very
- Page 196 and 197:
SPECIFIC EUROPEAN PREVENTIVE CAMPAI
- Page 198 and 199:
The material used was a triptych, c
- Page 200 and 201:
establishments. This first initiati
- Page 202 and 203:
The latest campaign which formed pa
- Page 204 and 205:
NETHERLANDSIn Holland, there have b
- Page 206 and 207:
Don’t force yourself to be always
- Page 208 and 209:
preventive strategies related to ec
- Page 210 and 211:
Within the harm minimisation strate
- Page 213 and 214:
11. PREVENTION PROPOSALSPREVENTION
- Page 215 and 216:
implied danger), but depending on w
- Page 217 and 218:
Despite the different policies on d
- Page 219 and 220:
12. GENERAL BIBLIOGRAPHY001. Abric,
- Page 221 and 222:
031. Díaz, A., Barruti, M. and Don
- Page 223 and 224:
misuse. Addiction 89.068. Kandel, D
- Page 225 and 226:
102. O’Rourke, P.J. (1985) Tune i
- Page 227:
137. Ureña, M.M. and Serra, F. (19
- Page 230 and 231:
The interview will be semi-structur
- Page 232 and 233:
♦ which subjects are the most fre
- Page 235 and 236:
ANNEX 3QUESTIONNAIRE OF SOCIALREPRE
- Page 237 and 238:
06. Birthplace (city and country):-
- Page 239 and 240:
19. In the last three months, how m
- Page 241 and 242:
30. Have you taken any other substa
- Page 243 and 244:
Next sentences are about your prefe
- Page 245 and 246:
SOCIAL REPRESENTATIONSINSTRUCTIONSB
- Page 247 and 248:
ANNEX 4PROTOCOL TO RECRUIT THE DISC
- Page 249 and 250:
⇒ envelopes with stamp and addres
- Page 251:
I R E F R E AIREFREA is a european