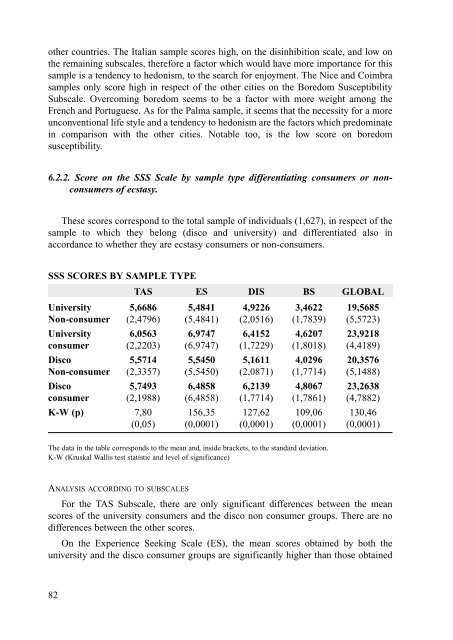
other countries. The Italian sample scores high, on the dis<strong>in</strong>hibition scale, <strong>and</strong> low onthe rema<strong>in</strong><strong>in</strong>g subscales, therefore a factor which would have more importance for thissample is a tendency to hedonism, to the search for enjoyment. The Nice <strong>and</strong> Coimbrasamples only score high <strong>in</strong> respect <strong>of</strong> the other cities on the Boredom SusceptibilitySubscale. Overcom<strong>in</strong>g boredom seems to be a factor with more weight among theFrench <strong>and</strong> Portuguese. As for the Palma sample, it seems that the necessity for a moreunconventional life style <strong>and</strong> a tendency to hedonism are the factors which predom<strong>in</strong>ate<strong>in</strong> comparison with the other cities. Notable too, is the low score on boredomsusceptibility.6.2.2. Score on the SSS Scale by sample type differentiat<strong>in</strong>g consumers or nonconsumers<strong>of</strong> <strong>ecstasy</strong>.These scores correspond to the total sample <strong>of</strong> <strong>in</strong>dividuals (1,627), <strong>in</strong> respect <strong>of</strong> thesample to which they belong (disco <strong>and</strong> university) <strong>and</strong> differentiated also <strong>in</strong>accordance to whether they are <strong>ecstasy</strong> consumers or non-consumers.SSS SCORES BY SAMPLE TYPETAS ES DIS BS GLOBALUniversity 5,6686 5,4841 4,9226 3,4622 19,5685Non-consumer (2,4796) (5,4841) (2,0516) (1,7839) (5,5723)University 6,0563 6,9747 6,4152 4,6207 23,9218consumer (2,2203) (6,9747) (1,7229) (1,8018) (4,4189)Disco 5,5714 5,5450 5,1611 4,0296 20,3576Non-consumer (2,3357) (5,5450) (2,0871) (1,7714) (5,1488)Disco 5,7493 6,4858 6,2139 4,8067 23,2638consumer (2,1988) (6,4858) (1,7714) (1,7861) (4,7882)K-W (p) 7,80 156,35 127,62 109,06 130,46(0,05) (0,0001) (0,0001) (0,0001) (0,0001)The data <strong>in</strong> the table corresponds to the mean <strong>and</strong>, <strong>in</strong>side brackets, to the st<strong>and</strong>ard deviation.K-W (Kruskal Wallis test statistic <strong>and</strong> level <strong>of</strong> significance)ANALYSIS ACCORDING TO SUBSCALESFor the TAS Subscale, there are only significant differences between the meanscores <strong>of</strong> the university consumers <strong>and</strong> the disco non consumer groups. There are nodifferences between the other scores.On the Experience Seek<strong>in</strong>g Scale (ES), the mean scores obta<strong>in</strong>ed by both theuniversity <strong>and</strong> the disco consumer groups are significantly higher than those obta<strong>in</strong>ed82
y the non-consumer groups. In addition, there are differences between the universityconsumers <strong>and</strong> the disco consumers, the scores <strong>of</strong> the first group be<strong>in</strong>g higher than thesecond. There are no significant differences between the two non <strong>ecstasy</strong> consumergroups.On the Dis<strong>in</strong>hibition (DIS) Subscale, the differences <strong>in</strong> means are significantbetween the consumer <strong>and</strong> non-consumer groups irrespective <strong>of</strong> whether they areuniversity or disco, those for the first group be<strong>in</strong>g higher.On the Boredom Susceptibility Scale (BS), the mean score <strong>of</strong> the university nonconsumergroup is significantly lower than that <strong>of</strong> the other groups, <strong>in</strong>clud<strong>in</strong>g disconon-consumers. In addition, there is also a difference between the disco non-consumergroup <strong>and</strong> the consumer groups, both disco <strong>and</strong> university.The score for the complete SSS <strong>in</strong>dicates that the consumer groups score higher onthe sensation seek<strong>in</strong>g scale than the non-consumer groups, there be<strong>in</strong>g no differencesbetween university or disco but only between consumers or non consumers.SUMMARYNon-consumers <strong>of</strong> <strong>ecstasy</strong>, either disco or university, always score below consumers.Therefore, the <strong>in</strong>dividuals perta<strong>in</strong><strong>in</strong>g to the <strong>ecstasy</strong> consumers sample, either disco oruniversity, are greater sensation seekers than the <strong>in</strong>dividuals <strong>in</strong> the non-consumers <strong>of</strong><strong>ecstasy</strong> sample.In addition, on the Susceptibility to Boredom Subscale (BS), we also f<strong>in</strong>d differentscores for the non-consumers, disco non-consumers scor<strong>in</strong>g higher than university nonconsumers.As for the consumer groups, there are no differences between disco consumers <strong>and</strong>university consumers on the overall scale. Nevertheless, on mak<strong>in</strong>g an analysis <strong>of</strong> thescores by subscales, we see that there are differences between these two samples on theExperience Seek<strong>in</strong>g Subscale. On this, the disco <strong>ecstasy</strong> consumers score above those<strong>of</strong> university.We see, then, that the most sensitive subscale, that is the one where there are moresignificant differences between the groups, is the Experiences Seek<strong>in</strong>g, followed byBoredom Susceptibility <strong>and</strong> Dis<strong>in</strong>hibition. The Thrills <strong>and</strong> Adventure Seek<strong>in</strong>g scaleshows least sensitivity.6.2.3. The SSS by consumption frequencies.The follow<strong>in</strong>g results <strong>of</strong> the Sensation Seek<strong>in</strong>g Scale, Version V by Zuckermannhave been taken from a total sample <strong>of</strong> 1,642 <strong>in</strong>dividuals, the addition <strong>of</strong> all the nationalsamples. The analysis was made by groups <strong>in</strong> accordance with their consumption level,dist<strong>in</strong>guish<strong>in</strong>g between the non-consumer (approximately half <strong>of</strong> the sample, because83
- Page 3 and 4:
ORGANISATIONS AND NATIONAL RESEARCH
- Page 5 and 6:
This volume is dedicated very speci
- Page 7 and 8:
PRESENTATIONIt’s a great pleasure
- Page 9 and 10:
INDEXPág.1. INTRODUCTION . . . . .
- Page 11 and 12:
1. INTRODUCTION1.1. DESIGNER DRUGS,
- Page 13:
the most widely used because its ef
- Page 16 and 17:
All this led to the famous English
- Page 18 and 19:
had used it in the preceding month.
- Page 20 and 21:
had used ecstasy or a similar subst
- Page 22 and 23:
school population found a prevalenc
- Page 24 and 25:
isk factors among adolescents (Cala
- Page 26 and 27:
make quantitative what is qualitati
- Page 28 and 29:
concentrated in ecstasy use. A stud
- Page 30 and 31: the others versions but with less i
- Page 33 and 34: 3. SAMPLE DESIGN AND FIELD WORK3.1.
- Page 35 and 36: Two different methods were suggeste
- Page 37 and 38: according to drug use level. Finall
- Page 39 and 40: We came into contact with eight ind
- Page 41 and 42: 4. SOCIODEMOGRAPHIC BACKGROUNDINTRO
- Page 43 and 44: We did not think it would be necess
- Page 45 and 46: STUDY LEVEL (% on global sample; %
- Page 47 and 48: In Utrecht, most of the young peopl
- Page 49: SUMMARYWe remind again that, in spi
- Page 52 and 53: This classification will be used fr
- Page 54 and 55: Montagne, 1992) or Rimini, in Italy
- Page 56 and 57: RELIGION PRACTITIONER (% on global
- Page 58 and 59: It stands out the high percentage o
- Page 60 and 61: Amphetamines are often used with fr
- Page 62 and 63: In the Utrecht sample, however, alt
- Page 64 and 65: GLOBAL SAMPLE ANSWERSThe most popul
- Page 66 and 67: These data are interesting in order
- Page 68 and 69: WITH WHOM TO CONSUME ECSTASY? (In %
- Page 70 and 71: As we have already seen in other ta
- Page 73 and 74: 6. SENSATION SEEKING SCALE (SSS)6.1
- Page 75 and 76: correlation’s varies in function
- Page 77 and 78: consumers sample comprises individu
- Page 79: DISINHIBITION (DIS)Modena, Palma an
- Page 83 and 84: Once again, on the Boredom Suscepti
- Page 85: this new scale. The individuals bel
- Page 88 and 89: Still following psychoanalysis, Koh
- Page 90 and 91: seeking scale, the hypotheses for t
- Page 92 and 93: SDS results according to sexSexPunc
- Page 94 and 95: understanding and explaining realit
- Page 96 and 97: there would be two more or less dif
- Page 98 and 99: RELATION BETWEEN ECSTASY AND SEXThe
- Page 100 and 101: of medicaments. In fact, they are p
- Page 102 and 103: In any case, it is true indeed that
- Page 104 and 105: Well aware that these interpretatio
- Page 106 and 107: with others, facilitates being able
- Page 108 and 109: 8.3.2. Social Representation in the
- Page 110 and 111: with problems”, “the problem wi
- Page 112 and 113: feel good”, “it causes euphoria
- Page 114 and 115: Therefore, and taking into account
- Page 116 and 117: appear in the diagram, as they have
- Page 118 and 119: as one of the reasons for taking ec
- Page 120 and 121: In the C diagram we see distributio
- Page 122 and 123: shy people” and “escape from re
- Page 124 and 125: We believe the adequate way of inte
- Page 126 and 127: In the C group there are five compo
- Page 128 and 129: ecause ecstasy use is connected wit
- Page 130 and 131:
Nowadays, three studies are being c
- Page 132 and 133:
can become addictive conducts and h
- Page 134 and 135:
therapeutic virtues that have been
- Page 136 and 137:
CESDIP/CNRS, Centre d’Etudes et d
- Page 138 and 139:
The Interior Ministry considers tha
- Page 140 and 141:
In spite of the methodological limi
- Page 142 and 143:
directed at investigating the quali
- Page 144 and 145:
follows; 60 % hash/marihuana, 11% e
- Page 146 and 147:
The results highlighted that respon
- Page 148 and 149:
young people interviewed considered
- Page 150 and 151:
In the last few years, however, in
- Page 152 and 153:
04) Ensuring that water is availabl
- Page 154 and 155:
♦ Zini G., Indagine sul consumo d
- Page 156 and 157:
Ossebaard, H.C. (1996). Drugspreven
- Page 158 and 159:
From the secondary school populatio
- Page 160 and 161:
Huizer, H. (1996). Rapport over het
- Page 162 and 163:
A related theme is to describe toda
- Page 164 and 165:
Verhulst, J. (1996). XTC kan altijd
- Page 166 and 167:
Because this review is meant to giv
- Page 168 and 169:
170Mudde, L. (1997). ‘XTC is nog
- Page 170 and 171:
2) The second research was carried
- Page 172 and 173:
Even so it is possible to make a di
- Page 174 and 175:
At the round table of social Analys
- Page 176 and 177:
2. Press articles regarding ecstasy
- Page 178 and 179:
Comas Arnau D, Velázquez Andrés J
- Page 180 and 181:
182estimulantes. p. 111-29.Salazar
- Page 182 and 183:
to the middle and upper classes. Th
- Page 184 and 185:
The culturally sensitive poly-consu
- Page 186 and 187:
SOCIAL REPRESENTATIONS OF CONSUMERS
- Page 188 and 189:
stereotype, there was also the mess
- Page 190 and 191:
their habitual environment, without
- Page 192 and 193:
experiment with drugs such as heroi
- Page 194 and 195:
This policy is being received very
- Page 196 and 197:
SPECIFIC EUROPEAN PREVENTIVE CAMPAI
- Page 198 and 199:
The material used was a triptych, c
- Page 200 and 201:
establishments. This first initiati
- Page 202 and 203:
The latest campaign which formed pa
- Page 204 and 205:
NETHERLANDSIn Holland, there have b
- Page 206 and 207:
Don’t force yourself to be always
- Page 208 and 209:
preventive strategies related to ec
- Page 210 and 211:
Within the harm minimisation strate
- Page 213 and 214:
11. PREVENTION PROPOSALSPREVENTION
- Page 215 and 216:
implied danger), but depending on w
- Page 217 and 218:
Despite the different policies on d
- Page 219 and 220:
12. GENERAL BIBLIOGRAPHY001. Abric,
- Page 221 and 222:
031. Díaz, A., Barruti, M. and Don
- Page 223 and 224:
misuse. Addiction 89.068. Kandel, D
- Page 225 and 226:
102. O’Rourke, P.J. (1985) Tune i
- Page 227:
137. Ureña, M.M. and Serra, F. (19
- Page 230 and 231:
The interview will be semi-structur
- Page 232 and 233:
♦ which subjects are the most fre
- Page 235 and 236:
ANNEX 3QUESTIONNAIRE OF SOCIALREPRE
- Page 237 and 238:
06. Birthplace (city and country):-
- Page 239 and 240:
19. In the last three months, how m
- Page 241 and 242:
30. Have you taken any other substa
- Page 243 and 244:
Next sentences are about your prefe
- Page 245 and 246:
SOCIAL REPRESENTATIONSINSTRUCTIONSB
- Page 247 and 248:
ANNEX 4PROTOCOL TO RECRUIT THE DISC
- Page 249 and 250:
⇒ envelopes with stamp and addres
- Page 251:
I R E F R E AIREFREA is a european


