GLOBAL SAMPLE ANSWERSThe most popular reasons for the <strong>ecstasy</strong> use are to dance (add<strong>in</strong>g the twopossibilities “Enjoy danc<strong>in</strong>g” <strong>and</strong> “ Dance longer”) with percentages between 21,6%(Modena) <strong>and</strong> 32,2% (Coimbra), “Escape from reality” with percentages between 9,9%<strong>in</strong> Coimbra <strong>and</strong> 23,8% <strong>in</strong> Modena, “ Feel good” frequently between 7,3% <strong>in</strong> Nice <strong>and</strong>22,4% <strong>in</strong> Utrecht <strong>and</strong> “Stimulate senses” with frequencies between 9,5% (Utrecht) <strong>and</strong>16,1% (Modena). We notice that danc<strong>in</strong>g is one <strong>of</strong> the most chosen answers, above allamong C, as we will see later on.The other 4 causes collected <strong>in</strong> the questionnaire are not <strong>of</strong>ten chosen. An importantexception is the answer “To Relax” which is chosen by 14,1% <strong>of</strong> the Dutch sample. One<strong>of</strong> the answers not selected frequently by the people was to take <strong>ecstasy</strong> “to have bettersexual relationships”. Nevertheless, <strong>in</strong> an other part <strong>of</strong> the questionnaire –the <strong>social</strong><strong>representation</strong> scale- the youngsters are <strong>in</strong>terrogated aga<strong>in</strong> on this subject <strong>and</strong> it seemsthat this time they demonstrate more <strong>in</strong>terest for the relation <strong>of</strong> sexuality <strong>and</strong> XTC. Infact 33,8% <strong>of</strong> the sample <strong>of</strong> NC <strong>and</strong> 45,1% <strong>of</strong> C do agree that <strong>ecstasy</strong> dis<strong>in</strong>hibitssexually.ANSWERS ACCORDING TO BEING OR NOT ECSTASY USER (C AND NC)“Escape from reality” is <strong>in</strong>terest<strong>in</strong>gly the most chosen answer by NC <strong>and</strong> the onethat shows the greatest differences between both groups. In the case <strong>of</strong> Utrecht, thesedifferences range from 22,6% (NC) to 6,3% (C), a similar distance to the one found <strong>in</strong>the sample <strong>of</strong> Coimbra with 18,3% (NC) <strong>and</strong> 6,4% (C). We consider this is aconsequence <strong>of</strong> the different <strong>social</strong> <strong>representation</strong> <strong>of</strong> MDMA between NC <strong>and</strong> C <strong>in</strong> asimilar way <strong>of</strong> what was shown <strong>in</strong> the last table <strong>in</strong> relation <strong>of</strong> different reasons why<strong>ecstasy</strong> produce problems.The relationship <strong>of</strong> the dance with this drug is <strong>of</strong>ten mentioned. Certa<strong>in</strong>ly, if weselect group C, the two possible answers connected with danc<strong>in</strong>g are the most chosen.These percentages are between 32,5% <strong>in</strong> Nice <strong>and</strong> 21,7% <strong>in</strong> Utrecht. Nevertheless,these data must show us that, from the po<strong>in</strong>t <strong>of</strong> view <strong>of</strong> prevention, the association<strong>ecstasy</strong>-dance is important but not exclusive, s<strong>in</strong>ce young people also associate <strong>ecstasy</strong>to other problems.Cont<strong>in</strong>u<strong>in</strong>g with the dance topic, it is <strong>in</strong>terest<strong>in</strong>g to emphasise the differences foundbetween NC <strong>and</strong> C, accord<strong>in</strong>g to the two questions connected with this matter. The NCgroup associates <strong>ecstasy</strong> above all with “Dance longer”, while C with “Enjoy danc<strong>in</strong>g”.THE FOLLOWING TABLES HAVE BEEN ANSWERED EXCLUSIVELY BY ECSTASY USERS OFEACH CITY AND BOTH THE DISCO SAMPLE AND THE UNIVERSITY SAMPLE HAVE BEEN PUTINTO ACCOUNT TOGETHER.66
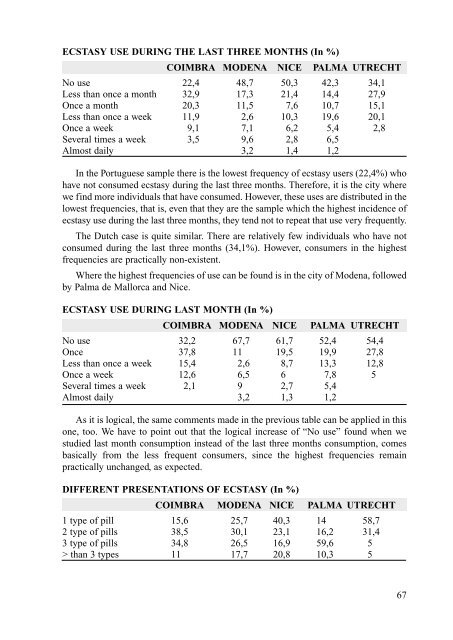
ECSTASY USE DURING THE LAST THREE MONTHS (In %)COIMBRA MODENA NICE PALMA UTRECHTNo use 22,4 48,7 50,3 42,3 34,1Less than once a month 32,9 17,3 21,4 14,4 27,9Once a month 20,3 11,5 07,6 10,7 15,1Less than once a week 11,9 02,6 10,3 19,6 20,1Once a week 09,1 07,1 06,2 05,4 02,8Several times a week 03,5 09,6 02,8 06,5Almost daily 03,2 01,4 01,2In the Portuguese sample there is the lowest frequency <strong>of</strong> <strong>ecstasy</strong> users (22,4%) whohave not consumed <strong>ecstasy</strong> dur<strong>in</strong>g the last three months. Therefore, it is the city wherewe f<strong>in</strong>d more <strong>in</strong>dividuals that have consumed. However, these uses are distributed <strong>in</strong> thelowest frequencies, that is, even that they are the sample which the highest <strong>in</strong>cidence <strong>of</strong><strong>ecstasy</strong> use dur<strong>in</strong>g the last three months, they tend not to repeat that use very frequently.The Dutch case is quite similar. There are relatively few <strong>in</strong>dividuals who have notconsumed dur<strong>in</strong>g the last three months (34,1%). However, consumers <strong>in</strong> the highestfrequencies are practically non-existent.Where the highest frequencies <strong>of</strong> use can be found is <strong>in</strong> the city <strong>of</strong> Modena, followedby Palma de Mallorca <strong>and</strong> Nice.ECSTASY USE DURING LAST MONTH (In %)COIMBRA MODENA NICE PALMA UTRECHTNo use 32,2 67,7 61,7 52,4 54,4Once 37,8 110, 19,5 19,9 27,8Less than once a week 15,4 02,6 08,7 13,3 12,8Once a week 12,6 06,5 060, 07,8 050,Several times a week 02,1 090, 02,7 05,4Almost daily 03,2 01,3 01,2As it is logical, the same comments made <strong>in</strong> the previous table can be applied <strong>in</strong> thisone, too. We have to po<strong>in</strong>t out that the logical <strong>in</strong>crease <strong>of</strong> “No use” found when westudied last month consumption <strong>in</strong>stead <strong>of</strong> the last three months consumption, comesbasically from the less frequent consumers, s<strong>in</strong>ce the highest frequencies rema<strong>in</strong>practically unchanged, as expected.DIFFERENT PRESENTATIONS OF ECSTASY (In %)COIMBRA MODENA NICE PALMA UTRECHT1 type <strong>of</strong> pill 15,6 25,7 40,3 140, 58,72 type <strong>of</strong> pills 38,5 30,1 23,1 16,2 31,43 type <strong>of</strong> pills 34,8 26,5 16,9 59,6 050,> than 3 types 110, 17,7 20,8 10,3 050,67
- Page 3 and 4:
ORGANISATIONS AND NATIONAL RESEARCH
- Page 5 and 6:
This volume is dedicated very speci
- Page 7 and 8:
PRESENTATIONIt’s a great pleasure
- Page 9 and 10:
INDEXPág.1. INTRODUCTION . . . . .
- Page 11 and 12:
1. INTRODUCTION1.1. DESIGNER DRUGS,
- Page 13: the most widely used because its ef
- Page 16 and 17: All this led to the famous English
- Page 18 and 19: had used it in the preceding month.
- Page 20 and 21: had used ecstasy or a similar subst
- Page 22 and 23: school population found a prevalenc
- Page 24 and 25: isk factors among adolescents (Cala
- Page 26 and 27: make quantitative what is qualitati
- Page 28 and 29: concentrated in ecstasy use. A stud
- Page 30 and 31: the others versions but with less i
- Page 33 and 34: 3. SAMPLE DESIGN AND FIELD WORK3.1.
- Page 35 and 36: Two different methods were suggeste
- Page 37 and 38: according to drug use level. Finall
- Page 39 and 40: We came into contact with eight ind
- Page 41 and 42: 4. SOCIODEMOGRAPHIC BACKGROUNDINTRO
- Page 43 and 44: We did not think it would be necess
- Page 45 and 46: STUDY LEVEL (% on global sample; %
- Page 47 and 48: In Utrecht, most of the young peopl
- Page 49: SUMMARYWe remind again that, in spi
- Page 52 and 53: This classification will be used fr
- Page 54 and 55: Montagne, 1992) or Rimini, in Italy
- Page 56 and 57: RELIGION PRACTITIONER (% on global
- Page 58 and 59: It stands out the high percentage o
- Page 60 and 61: Amphetamines are often used with fr
- Page 62 and 63: In the Utrecht sample, however, alt
- Page 66 and 67: These data are interesting in order
- Page 68 and 69: WITH WHOM TO CONSUME ECSTASY? (In %
- Page 70 and 71: As we have already seen in other ta
- Page 73 and 74: 6. SENSATION SEEKING SCALE (SSS)6.1
- Page 75 and 76: correlation’s varies in function
- Page 77 and 78: consumers sample comprises individu
- Page 79 and 80: DISINHIBITION (DIS)Modena, Palma an
- Page 81 and 82: y the non-consumer groups. In addit
- Page 83 and 84: Once again, on the Boredom Suscepti
- Page 85: this new scale. The individuals bel
- Page 88 and 89: Still following psychoanalysis, Koh
- Page 90 and 91: seeking scale, the hypotheses for t
- Page 92 and 93: SDS results according to sexSexPunc
- Page 94 and 95: understanding and explaining realit
- Page 96 and 97: there would be two more or less dif
- Page 98 and 99: RELATION BETWEEN ECSTASY AND SEXThe
- Page 100 and 101: of medicaments. In fact, they are p
- Page 102 and 103: In any case, it is true indeed that
- Page 104 and 105: Well aware that these interpretatio
- Page 106 and 107: with others, facilitates being able
- Page 108 and 109: 8.3.2. Social Representation in the
- Page 110 and 111: with problems”, “the problem wi
- Page 112 and 113: feel good”, “it causes euphoria
- Page 114 and 115:
Therefore, and taking into account
- Page 116 and 117:
appear in the diagram, as they have
- Page 118 and 119:
as one of the reasons for taking ec
- Page 120 and 121:
In the C diagram we see distributio
- Page 122 and 123:
shy people” and “escape from re
- Page 124 and 125:
We believe the adequate way of inte
- Page 126 and 127:
In the C group there are five compo
- Page 128 and 129:
ecause ecstasy use is connected wit
- Page 130 and 131:
Nowadays, three studies are being c
- Page 132 and 133:
can become addictive conducts and h
- Page 134 and 135:
therapeutic virtues that have been
- Page 136 and 137:
CESDIP/CNRS, Centre d’Etudes et d
- Page 138 and 139:
The Interior Ministry considers tha
- Page 140 and 141:
In spite of the methodological limi
- Page 142 and 143:
directed at investigating the quali
- Page 144 and 145:
follows; 60 % hash/marihuana, 11% e
- Page 146 and 147:
The results highlighted that respon
- Page 148 and 149:
young people interviewed considered
- Page 150 and 151:
In the last few years, however, in
- Page 152 and 153:
04) Ensuring that water is availabl
- Page 154 and 155:
♦ Zini G., Indagine sul consumo d
- Page 156 and 157:
Ossebaard, H.C. (1996). Drugspreven
- Page 158 and 159:
From the secondary school populatio
- Page 160 and 161:
Huizer, H. (1996). Rapport over het
- Page 162 and 163:
A related theme is to describe toda
- Page 164 and 165:
Verhulst, J. (1996). XTC kan altijd
- Page 166 and 167:
Because this review is meant to giv
- Page 168 and 169:
170Mudde, L. (1997). ‘XTC is nog
- Page 170 and 171:
2) The second research was carried
- Page 172 and 173:
Even so it is possible to make a di
- Page 174 and 175:
At the round table of social Analys
- Page 176 and 177:
2. Press articles regarding ecstasy
- Page 178 and 179:
Comas Arnau D, Velázquez Andrés J
- Page 180 and 181:
182estimulantes. p. 111-29.Salazar
- Page 182 and 183:
to the middle and upper classes. Th
- Page 184 and 185:
The culturally sensitive poly-consu
- Page 186 and 187:
SOCIAL REPRESENTATIONS OF CONSUMERS
- Page 188 and 189:
stereotype, there was also the mess
- Page 190 and 191:
their habitual environment, without
- Page 192 and 193:
experiment with drugs such as heroi
- Page 194 and 195:
This policy is being received very
- Page 196 and 197:
SPECIFIC EUROPEAN PREVENTIVE CAMPAI
- Page 198 and 199:
The material used was a triptych, c
- Page 200 and 201:
establishments. This first initiati
- Page 202 and 203:
The latest campaign which formed pa
- Page 204 and 205:
NETHERLANDSIn Holland, there have b
- Page 206 and 207:
Don’t force yourself to be always
- Page 208 and 209:
preventive strategies related to ec
- Page 210 and 211:
Within the harm minimisation strate
- Page 213 and 214:
11. PREVENTION PROPOSALSPREVENTION
- Page 215 and 216:
implied danger), but depending on w
- Page 217 and 218:
Despite the different policies on d
- Page 219 and 220:
12. GENERAL BIBLIOGRAPHY001. Abric,
- Page 221 and 222:
031. Díaz, A., Barruti, M. and Don
- Page 223 and 224:
misuse. Addiction 89.068. Kandel, D
- Page 225 and 226:
102. O’Rourke, P.J. (1985) Tune i
- Page 227:
137. Ureña, M.M. and Serra, F. (19
- Page 230 and 231:
The interview will be semi-structur
- Page 232 and 233:
♦ which subjects are the most fre
- Page 235 and 236:
ANNEX 3QUESTIONNAIRE OF SOCIALREPRE
- Page 237 and 238:
06. Birthplace (city and country):-
- Page 239 and 240:
19. In the last three months, how m
- Page 241 and 242:
30. Have you taken any other substa
- Page 243 and 244:
Next sentences are about your prefe
- Page 245 and 246:
SOCIAL REPRESENTATIONSINSTRUCTIONSB
- Page 247 and 248:
ANNEX 4PROTOCOL TO RECRUIT THE DISC
- Page 249 and 250:
⇒ envelopes with stamp and addres
- Page 251:
I R E F R E AIREFREA is a european