- Page 1:
UNESCO SCIENCE REPORT Towards 2030
- Page 4 and 5:
Published in 2015 by the United Nat
- Page 6 and 7:
Report team Director of the Publica
- Page 8 and 9:
UNESCO SCIENCE REPORT A closer look
- Page 10 and 11:
UNESCO SCIENCE REPORT Illustrations
- Page 12 and 13:
UNESCO SCIENCE REPORT Figure 6.1: E
- Page 14 and 15:
UNESCO SCIENCE REPORT Figure 10.2:
- Page 16 and 17:
UNESCO SCIENCE REPORT Figure 16.5:
- Page 18 and 19:
UNESCO SCIENCE REPORT Figure 20.3:
- Page 20 and 21:
UNESCO SCIENCE REPORT Table 25.1. S
- Page 22 and 23:
Foreword Irina Bokova, Director-Gen
- Page 24 and 25:
xxii
- Page 26 and 27:
UNESCO SCIENCE REPORT 2016 Internat
- Page 28 and 29:
UNESCO SCIENCE REPORT strained in m
- Page 30 and 31:
A more developmental approach to sc
- Page 32 and 33:
UNESCO SCIENCE REPORT in the contex
- Page 34 and 35:
UNESCO SCIENCE REPORT There are cou
- Page 36 and 37:
Science for a sustainable and just
- Page 38 and 39:
UNESCO SCIENCE REPORT provides a ne
- Page 40 and 41:
UNESCO SCIENCE REPORT subjectivity,
- Page 42 and 43:
UNESCO SCIENCE REPORT 2016 20 18
- Page 44 and 45:
Many dilemmas appear increasingly c
- Page 46 and 47:
UNESCO SCIENCE REPORT complement th
- Page 48 and 49:
UNESCO SCIENCE REPORT contraried by
- Page 50 and 51:
UNESCO SCIENCE REPORT Table 1.2: Wo
- Page 52 and 53:
UNESCO SCIENCE REPORT Figure 1.1: G
- Page 54 and 55:
UNESCO SCIENCE REPORT The danger is
- Page 56 and 57:
UNESCO SCIENCE REPORT Table 1.3: Wo
- Page 58 and 59:
UNESCO SCIENCE REPORT Figure 1.4: L
- Page 60 and 61:
UNESCO SCIENCE REPORT Table 1.4: Wo
- Page 62 and 63:
UNESCO SCIENCE REPORT Table 1.5: Pa
- Page 64 and 65:
UNESCO SCIENCE REPORT Figure 1.7: W
- Page 66 and 67:
UNESCO SCIENCE REPORT The countries
- Page 68 and 69:
UNESCO SCIENCE REPORT Research Coun
- Page 70 and 71:
UNESCO SCIENCE REPORT to create res
- Page 72 and 73:
UNESCO SCIENCE REPORT So far, the r
- Page 74 and 75:
UNESCO SCIENCE REPORT a number of r
- Page 76 and 77:
UNESCO SCIENCE REPORT Southeast Asi
- Page 78 and 79:
UNESCO SCIENCE REPORT major implica
- Page 80 and 81:
Policy-makers should ... focus not
- Page 82 and 83:
Figure UNESCO 2.1: SCIENCE Trends i
- Page 84 and 85:
UNESCO SCIENCE REPORT We shall also
- Page 86 and 87:
UNESCO SCIENCE REPORT Figure 2.3: I
- Page 88 and 89:
UNESCO SCIENCE REPORT Figure 2.5: T
- Page 90 and 91:
Figure UNESCO 2.6: SCIENCE Trends i
- Page 92 and 93:
Figure UNESCO 2.6 SCIENCE (continue
- Page 94 and 95:
UNESCO SCIENCE REPORT Firms prefer
- Page 96 and 97:
UNESCO SCIENCE REPORT Table 2.2: Hi
- Page 98 and 99:
UNESCO SCIENCE REPORT Figure 2.9: F
- Page 100 and 101:
UNESCO SCIENCE REPORT drain. In 199
- Page 102 and 103:
UNESCO Figure 2.12: SCIENCE Preferr
- Page 104 and 105:
UNESCO SCIENCE REPORT Figure 2.13:
- Page 106 and 107:
UNESCO SCIENCE REPORT CONCLUSION In
- Page 108 and 109:
UNESCO SCIENCE REPORT Gender equali
- Page 110 and 111:
UNESCO SCIENCE REPORT Figure 3.1: T
- Page 112 and 113:
UNESCO SCIENCE REPORT Figure 3.2: S
- Page 114 and 115:
UNESCO SCIENCE REPORT Figure 3.3: S
- Page 116 and 117:
UNESCO SCIENCE REPORT Table 3.2: Sh
- Page 118 and 119:
UNESCO SCIENCE REPORT Factoring in
- Page 120 and 121:
UNESCO SCIENCE REPORT views of wome
- Page 122 and 123:
UNESCO SCIENCE REPORT POLICY ISSUES
- Page 124 and 125:
UNESCO SCIENCE REPORT are defined a
- Page 126 and 127:
UNESCO SCIENCE REPORT CONCLUSION A
- Page 128 and 129:
UNESCO SCIENCE REPORT 2016 22 104
- Page 130 and 131:
Science powers commerce - but not o
- Page 132 and 133:
UNESCO SCIENCE REPORT Some challeng
- Page 134 and 135:
UNESCO SCIENCE REPORT Table 4.2: R&
- Page 136 and 137:
UNESCO SCIENCE REPORT How best to i
- Page 138 and 139:
Figure 4.5: Scientific publication
- Page 140 and 141:
UNESCO SCIENCE REPORT Figure 4.6: M
- Page 142 and 143:
UNESCO SCIENCE REPORT businesses of
- Page 144 and 145:
UNESCO SCIENCE REPORT Canadian Acad
- Page 146 and 147:
UNESCO SCIENCE REPORT Figure 4.8: D
- Page 148 and 149:
UNESCO SCIENCE REPORT In 2014, the
- Page 150 and 151:
UNESCO SCIENCE REPORT CONCLUSION Sc
- Page 152 and 153:
The future looks brighter for busin
- Page 154 and 155:
UNESCO SCIENCE REPORT Figure 5.2: G
- Page 156 and 157:
UNESCO SCIENCE REPORT Policy and Co
- Page 158 and 159:
UNESCO SCIENCE REPORT Box 5.1: The
- Page 160 and 161:
UNESCO SCIENCE REPORT Box 5.2: Indu
- Page 162 and 163:
UNESCO SCIENCE REPORT Figure 5.4: R
- Page 164 and 165:
UNESCO SCIENCE REPORT Figure 5.5: P
- Page 166 and 167:
UNESCO Figure 5.6: SCIENCE Science
- Page 168 and 169:
UNESCO SCIENCE REPORT federal inves
- Page 170 and 171:
UNESCO SCIENCE REPORT Box 5.3: The
- Page 172 and 173:
UNESCO SCIENCE REPORT Figure 5.10:
- Page 174 and 175:
UNESCO Figure 5.11: SCIENCE Scienti
- Page 176 and 177:
UNESCO SCIENCE REPORT More foreign
- Page 178 and 179:
UNESCO SCIENCE REPORT had an advers
- Page 180 and 181:
UNESCO SCIENCE REPORT In the absenc
- Page 182 and 183:
UNESCO SCIENCE REPORT Figure 6.1: E
- Page 184 and 185:
UNESCO SCIENCE REPORT Figure 6.4: E
- Page 186 and 187:
UNESCO SCIENCE REPORT Table 6.2: Ov
- Page 188 and 189:
UNESCO SCIENCE REPORT Chronic under
- Page 190 and 191:
UNESCO SCIENCE REPORT The campus ha
- Page 192 and 193:
UNESCO SCIENCE REPORT Figure 6.8: R
- Page 194 and 195:
Bahamas UNESCO SCIENCE REPORT Beliz
- Page 196 and 197:
UNESCO SCIENCE REPORT Figure 6.10:
- Page 198 and 199:
UNESCO SCIENCE REPORT A variety of
- Page 200 and 201:
UNESCO SCIENCE REPORT In Venezuela,
- Page 202 and 203:
UNESCO SCIENCE REPORT Figure 7.3: T
- Page 204 and 205:
UNESCO SCIENCE REPORT A shift towar
- Page 206 and 207:
Figure 7.4: Trends in higher educat
- Page 208 and 209:
UNESCO SCIENCE REPORT The Start-Up
- Page 210 and 211:
UNESCO Figure 7.7: SCIENCE Trends i
- Page 212 and 213:
UNESCO SCIENCE REPORT TRENDS IN R&D
- Page 214 and 215:
Figure 7.8 (continued) Life science
- Page 216 and 217:
UNESCO SCIENCE REPORT For example,
- Page 218 and 219:
UNESCO SCIENCE REPORT Figure 7.9: P
- Page 220 and 221:
UNESCO SCIENCE REPORT the major cha
- Page 222 and 223:
UNESCO SCIENCE REPORT Table 7.4: Na
- Page 224 and 225:
UNESCO SCIENCE REPORT these service
- Page 226 and 227:
UNESCO SCIENCE REPORT n the creatio
- Page 228 and 229:
UNESCO SCIENCE REPORT Box 7.4: Ikia
- Page 230 and 231:
UNESCO SCIENCE REPORT n Strengtheni
- Page 232 and 233:
UNESCO SCIENCE REPORT A second grou
- Page 234 and 235:
UNESCO SCIENCE REPORT Industry must
- Page 236 and 237:
UNESCO SCIENCE REPORT have regained
- Page 238 and 239:
UNESCO SCIENCE REPORT The Fourth 3
- Page 240 and 241:
UNESCO SCIENCE REPORT average in ma
- Page 242 and 243:
UNESCO SCIENCE REPORT Figure 8.5: S
- Page 244 and 245:
UNESCO SCIENCE REPORT Figure 8.7: G
- Page 246 and 247:
UNESCO SCIENCE REPORT Box 8.5: Inno
- Page 248 and 249:
UNESCO SCIENCE REPORT Table 8.1: In
- Page 250 and 251:
UNESCO Figure 8.12: SCIENCE Relativ
- Page 252 and 253:
UNESCO SCIENCE REPORT Box 8.6: The
- Page 254 and 255:
UNESCO SCIENCE REPORT The European
- Page 256 and 257:
UNESCO SCIENCE REPORT The first sig
- Page 258 and 259:
UNESCO SCIENCE REPORT 72 months. Wh
- Page 260 and 261:
UNESCO SCIENCE REPORT Table 9.2: GE
- Page 262 and 263:
UNESCO SCIENCE REPORT Figure 9.4: B
- Page 264 and 265:
UNESCO SCIENCE REPORT Table 9.4: To
- Page 266 and 267:
UNESCO SCIENCE REPORT Figure 9.6: I
- Page 268 and 269:
UNESCO SCIENCE REPORT Table 9.7: (c
- Page 270 and 271:
UNESCO SCIENCE REPORT Table 9.7: (c
- Page 272 and 273:
UNESCO SCIENCE REPORT EU had alread
- Page 274 and 275:
UNESCO SCIENCE REPORT demand and fu
- Page 276 and 277:
UNESCO SCIENCE REPORT Table 9.11: E
- Page 278 and 279:
UNESCO SCIENCE REPORT Table 9.12: E
- Page 280 and 281:
UNESCO SCIENCE REPORT Box 9.2: Gali
- Page 282 and 283:
UNESCO Figure 9.9: SCIENCE Scientif
- Page 284 and 285:
Figure 9.10: Publication profiles i
- Page 286 and 287:
Figure 9.11 (continued) All EU memb
- Page 288 and 289:
UNESCO SCIENCE REPORT comprises a p
- Page 290 and 291:
UNESCO SCIENCE REPORT GREECE Aligni
- Page 292 and 293:
UNESCO SCIENCE REPORT SPAIN Making
- Page 294 and 295:
UNESCO SCIENCE REPORT CONCLUSION In
- Page 296 and 297:
UNESCO SCIENCE REPORT Southeast Eur
- Page 298 and 299:
UNESCO SCIENCE REPORT The effects o
- Page 300 and 301:
UNESCO SCIENCE REPORT Box 10.2: Sou
- Page 302 and 303:
UNESCO SCIENCE REPORT Figure 10.1:
- Page 304 and 305:
UNESCO SCIENCE REPORT Figure 10.4:
- Page 306 and 307:
UNESCO SCIENCE REPORT Figure 10.6:
- Page 308 and 309:
UNESCO SCIENCE REPORT COUNTRY PROFI
- Page 310 and 311:
UNESCO SCIENCE REPORT According to
- Page 312 and 313:
UNESCO SCIENCE REPORT Box 10.3: A f
- Page 314 and 315:
UNESCO SCIENCE REPORT n a small num
- Page 316 and 317:
UNESCO SCIENCE REPORT has facilitat
- Page 318 and 319:
UNESCO SCIENCE REPORT Countries wil
- Page 320 and 321:
UNESCO SCIENCE REPORT A few adjustm
- Page 322 and 323:
UNESCO SCIENCE REPORT Figure 11.1:
- Page 324 and 325:
UNESCO SCIENCE REPORT Table 11.1: I
- Page 326 and 327:
Figure 11.3: Scientific publication
- Page 328 and 329:
UNESCO SCIENCE REPORT NORWAY Knowle
- Page 330 and 331:
UNESCO SCIENCE REPORT Figure 11.6:
- Page 332 and 333:
UNESCO SCIENCE REPORT polytechnique
- Page 334 and 335:
UNESCO SCIENCE REPORT Taken togethe
- Page 336 and 337:
UNESCO SCIENCE REPORT All seven cou
- Page 338 and 339:
UNESCO SCIENCE REPORT Many post-Sov
- Page 340 and 341:
UNESCO SCIENCE REPORT Table 12.2: T
- Page 342 and 343:
UNESCO SCIENCE REPORT Figure 12.3:
- Page 344 and 345:
UNESCO SCIENCE REPORT n On the whol
- Page 346 and 347:
UNESCO Figure 12.6: SCIENCE Scienti
- Page 348 and 349:
UNESCO SCIENCE REPORT COUNTRY PROFI
- Page 350 and 351:
UNESCO SCIENCE REPORT currently wor
- Page 352 and 353:
UNESCO SCIENCE REPORT Next steps fo
- Page 354 and 355:
UNESCO SCIENCE REPORT corruption an
- Page 356 and 357:
UNESCO SCIENCE REPORT schemes inclu
- Page 358 and 359:
UNESCO SCIENCE REPORT A highly cent
- Page 360 and 361:
UNESCO SCIENCE REPORT UKRAINE Co-op
- Page 362 and 363:
UNESCO SCIENCE REPORT For one thing
- Page 364 and 365:
UNESCO SCIENCE REPORT REFERENCES Ci
- Page 366 and 367:
UNESCO SCIENCE REPORT Boosting supp
- Page 368 and 369:
UNESCO SCIENCE REPORT of Economic D
- Page 370 and 371:
Figure 13.1: Trends in GERD 1.29% 1
- Page 372 and 373:
UNESCO SCIENCE REPORT In 2009, the
- Page 374 and 375:
UNESCO SCIENCE REPORT an imbalance
- Page 376 and 377:
UNESCO SCIENCE REPORT In recent yea
- Page 378 and 379:
UNESCO SCIENCE REPORT n assigning i
- Page 380 and 381:
UNESCO SCIENCE REPORT Box 13.2: Ref
- Page 382 and 383:
UNESCO SCIENCE REPORT Along with th
- Page 384 and 385:
UNESCO SCIENCE REPORT More bridges
- Page 386 and 387:
UNESCO SCIENCE REPORT CONCLUSION A
- Page 388 and 389:
UNESCO SCIENCE REPORT Progress in C
- Page 390 and 391:
UNESCO SCIENCE REPORT Bakiyev was d
- Page 392 and 393:
UNESCO SCIENCE REPORT A focus on un
- Page 394 and 395:
UNESCO SCIENCE REPORT Table 14.2: C
- Page 396 and 397:
RUSSIAN FEDERATION UNESCO Figure 14
- Page 398 and 399:
UNESCO SCIENCE REPORT COUNTRY PROFI
- Page 400 and 401:
UNESCO SCIENCE REPORT Table 14.3: K
- Page 402 and 403:
UNESCO SCIENCE REPORT reliant on en
- Page 404 and 405:
UNESCO SCIENCE REPORT Kyrgyzstan ne
- Page 406 and 407:
UNESCO SCIENCE REPORT it comes to i
- Page 408 and 409:
UNESCO SCIENCE REPORT One of the fi
- Page 410 and 411:
UNESCO SCIENCE REPORT Box 14.5: Uzb
- Page 412 and 413:
UNESCO SCIENCE REPORT Indirectly, i
- Page 414 and 415:
Figure 15.1: Scientific publication
- Page 416 and 417:
UNESCO SCIENCE REPORT President Rou
- Page 418 and 419:
UNESCO SCIENCE REPORT The following
- Page 420 and 421:
UNESCO SCIENCE REPORT Medicine Medi
- Page 422 and 423:
UNESCO SCIENCE REPORT Figure 15.4:
- Page 424 and 425:
UNESCO SCIENCE REPORT Table 15.2: G
- Page 426 and 427:
UNESCO SCIENCE REPORT Box 15.3: The
- Page 428 and 429:
UNESCO Figure 15.5: SCIENCE Trends
- Page 430 and 431:
UNESCO SCIENCE REPORT KEY TARGETS F
- Page 432 and 433:
UNESCO SCIENCE REPORT Israel needs
- Page 434 and 435:
UNESCO SCIENCE REPORT Data released
- Page 436 and 437:
UNESCO SCIENCE REPORT ranks 26th ou
- Page 438 and 439:
UNESCO SCIENCE REPORT Figure 16.7:
- Page 440 and 441:
UNESCO SCIENCE REPORT A shortage of
- Page 442 and 443:
Figure UNESCO 16.11: SCIENCE Scient
- Page 444 and 445:
UNESCO SCIENCE REPORT of NIS 88 mil
- Page 446 and 447:
UNESCO SCIENCE REPORT Parkinson’s
- Page 448 and 449:
UNESCO SCIENCE REPORT Figure 16.12:
- Page 450 and 451:
UNESCO SCIENCE REPORT TRENDS IN SCI
- Page 452 and 453:
UNESCO SCIENCE REPORT The Sixth Hig
- Page 454 and 455:
UNESCO SCIENCE REPORT The Arab worl
- Page 456 and 457:
UNESCO SCIENCE REPORT Box 17.1: Upg
- Page 458 and 459:
UNESCO SCIENCE REPORT Table 17.1: S
- Page 460 and 461:
UNESCO SCIENCE REPORT Figure 17.3:
- Page 462 and 463:
UNESCO SCIENCE REPORT the regional
- Page 464 and 465:
UNESCO SCIENCE REPORT In several co
- Page 466 and 467:
UNESCO SCIENCE REPORT Table 17.4: S
- Page 468 and 469:
Figure 17.10: Scientific publicatio
- Page 470 and 471:
UNESCO Figure 17.10 SCIENCE (contin
- Page 472 and 473:
UNESCO SCIENCE REPORT Figure 17.11:
- Page 474 and 475:
UNESCO SCIENCE REPORT Zewail City f
- Page 476 and 477:
UNESCO SCIENCE REPORT Box 17.3: SES
- Page 478 and 479:
UNESCO SCIENCE REPORT Figure 17.13:
- Page 480 and 481:
UNESCO SCIENCE REPORT R&D prioritie
- Page 482 and 483:
UNESCO SCIENCE REPORT n The third I
- Page 484 and 485:
UNESCO SCIENCE REPORT entrepreneurs
- Page 486 and 487:
UNESCO SCIENCE REPORT to brain drai
- Page 488 and 489:
UNESCO SCIENCE REPORT Maghreb. Esta
- Page 490 and 491:
UNESCO SCIENCE REPORT safety and th
- Page 492 and 493:
UNESCO SCIENCE REPORT REFERENCES Ab
- Page 494 and 495:
UNESCO SCIENCE REPORT Countries hav
- Page 496 and 497:
UNESCO SCIENCE REPORT Guinea-Bissau
- Page 498 and 499:
UNESCO SCIENCE REPORT GDP to higher
- Page 500 and 501:
UNESCO SCIENCE REPORT A REGIONAL VI
- Page 502 and 503:
UNESCO SCIENCE REPORT n establish s
- Page 504 and 505:
UNESCO SCIENCE REPORT Table 18.4: T
- Page 506 and 507:
UNESCO SCIENCE REPORT A modest publ
- Page 508 and 509:
UNESCO Figure 18.6: SCIENCE Scienti
- Page 510 and 511:
UNESCO SCIENCE REPORT CABO VERDE A
- Page 512 and 513:
UNESCO SCIENCE REPORT The establish
- Page 514 and 515:
UNESCO SCIENCE REPORT In addition t
- Page 516 and 517:
UNESCO SCIENCE REPORT Since 2009, t
- Page 518 and 519:
UNESCO SCIENCE REPORT n In October
- Page 520 and 521:
UNESCO SCIENCE REPORT developing a
- Page 522 and 523:
Most countries have based their lon
- Page 524 and 525:
UNESCO SCIENCE REPORT Table 19.1: S
- Page 526 and 527:
UNESCO SCIENCE REPORT Figure 19.2:
- Page 528 and 529:
UNESCO SCIENCE REPORT Table 19.2: I
- Page 530 and 531:
UNESCO SCIENCE REPORT Box 19.1: Net
- Page 532 and 533:
UNESCO SCIENCE REPORT Figure 19.3:
- Page 534 and 535:
UNESCO SCIENCE REPORT TRENDS IN EDU
- Page 536 and 537:
UNESCO SCIENCE REPORT The governmen
- Page 538 and 539:
UNESCO Figure 19.8: SCIENCE Scienti
- Page 540 and 541:
UNESCO SCIENCE REPORT COUNTRY PROFI
- Page 542 and 543:
UNESCO SCIENCE REPORT n raising the
- Page 544 and 545:
UNESCO SCIENCE REPORT Despite these
- Page 546 and 547:
UNESCO SCIENCE REPORT n Services Ga
- Page 548 and 549:
UNESCO SCIENCE REPORT The Kenya Nat
- Page 550 and 551:
UNESCO SCIENCE REPORT Plans to beco
- Page 552 and 553:
UNESCO SCIENCE REPORT Sudan without
- Page 554 and 555:
UNESCO SCIENCE REPORT of France Tel
- Page 556 and 557:
UNESCO SCIENCE REPORT REFERENCES Af
- Page 558 and 559:
An important aspect of economic int
- Page 560 and 561:
UNESCO SCIENCE REPORT Table 20.1: S
- Page 562 and 563:
UNESCO SCIENCE REPORT Figure 20.2:
- Page 564 and 565:
UNESCO SCIENCE REPORT Box 20.1 The
- Page 566 and 567:
UNESCO SCIENCE REPORT Gender equity
- Page 568 and 569:
UNESCO Figure 20.6: SCIENCE Scienti
- Page 570 and 571:
UNESCO SCIENCE REPORT COUNTRY PROFI
- Page 572 and 573:
UNESCO SCIENCE REPORT DEMOCRATIC RE
- Page 574 and 575:
UNESCO SCIENCE REPORT private secto
- Page 576 and 577:
UNESCO SCIENCE REPORT To a large ex
- Page 578 and 579:
UNESCO SCIENCE REPORT Two reputable
- Page 580 and 581:
UNESCO SCIENCE REPORT Table 20.6: S
- Page 582 and 583:
UNESCO SCIENCE REPORT A popular des
- Page 584 and 585:
UNESCO SCIENCE REPORT turn, reviewe
- Page 586 and 587:
UNESCO SCIENCE REPORT Innovation Fu
- Page 588 and 589: UNESCO SCIENCE REPORT This counter-
- Page 590 and 591: UNESCO SCIENCE REPORT Without adequ
- Page 592 and 593: UNESCO SCIENCE REPORT Figure 21.2:
- Page 594 and 595: UNESCO SCIENCE REPORT TRENDS IN EDU
- Page 596 and 597: UNESCO SCIENCE REPORT Box 21.2: Sou
- Page 598 and 599: UNESCO SCIENCE REPORT Figure 21.6:
- Page 600 and 601: Figure UNESCO 21.8: SCIENCE Scienti
- Page 602 and 603: UNESCO SCIENCE REPORT COUNTRY PROFI
- Page 604 and 605: UNESCO SCIENCE REPORT all faculty,
- Page 606 and 607: UNESCO SCIENCE REPORT n attain self
- Page 608 and 609: UNESCO SCIENCE REPORT the governmen
- Page 610 and 611: UNESCO SCIENCE REPORT The Ministry
- Page 612 and 613: UNESCO SCIENCE REPORT PAKISTAN Plan
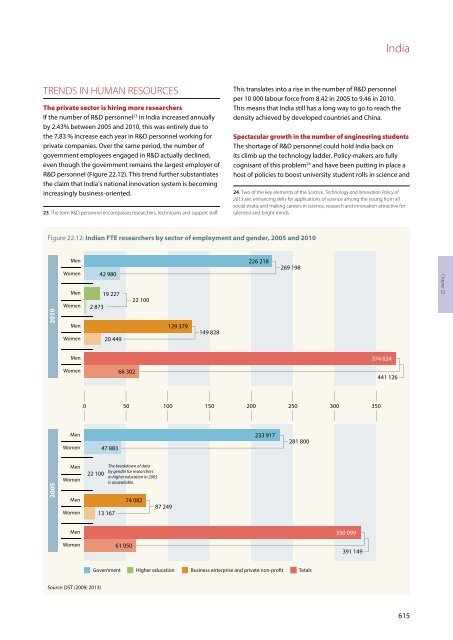
- Page 614 and 615: UNESCO SCIENCE REPORT Table 21.4: R
- Page 616 and 617: UNESCO SCIENCE REPORT Sri Lanka has
- Page 618 and 619: UNESCO SCIENCE REPORT Box 21.7: Dev
- Page 620 and 621: UNESCO SCIENCE REPORT of the electr
- Page 622 and 623: UNESCO SCIENCE REPORT The governmen
- Page 624 and 625: UNESCO SCIENCE REPORT years but it
- Page 626 and 627: UNESCO SCIENCE REPORT the success o
- Page 628 and 629: UNESCO SCIENCE REPORT Table 22.2: D
- Page 630 and 631: UNESCO SCIENCE REPORT Figure 22.5:
- Page 632 and 633: UNESCO SCIENCE REPORT Table 22.4: E
- Page 634 and 635: UNESCO SCIENCE REPORT innovation co
- Page 636 and 637: UNESCO SCIENCE REPORT thrusts: impr
- Page 640 and 641: UNESCO SCIENCE REPORT engineering p
- Page 642 and 643: UNESCO SCIENCE REPORT CONCLUSION In
- Page 644 and 645: UNESCO SCIENCE REPORT The ‘new no
- Page 646 and 647: UNESCO SCIENCE REPORT Figure 23.1:
- Page 648 and 649: UNESCO SCIENCE REPORT Figure 23.2:
- Page 650 and 651: UNESCO SCIENCE REPORT Figure 23.5:
- Page 652 and 653: UNESCO SCIENCE REPORT TRENDS IN STI
- Page 654 and 655: UNESCO SCIENCE REPORT papers. China
- Page 656 and 657: UNESCO SCIENCE REPORT endogenous in
- Page 658 and 659: UNESCO SCIENCE REPORT Box 23.4: Wat
- Page 660 and 661: UNESCO SCIENCE REPORT Rethinking go
- Page 662 and 663: UNESCO SCIENCE REPORT monitoring pr
- Page 664 and 665: UNESCO SCIENCE REPORT information a
- Page 666 and 667: UNESCO SCIENCE REPORT Japan needs t
- Page 668 and 669: UNESCO SCIENCE REPORT crisis of 200
- Page 670 and 671: UNESCO SCIENCE REPORT In 2014, a ne
- Page 672 and 673: UNESCO SCIENCE REPORT Figure 24.1:
- Page 674 and 675: UNESCO SCIENCE REPORT TRENDS IN R&D
- Page 676 and 677: UNESCO SCIENCE REPORT Figure 24.3:
- Page 678 and 679: Figure 24.7: Scientific publication
- Page 680 and 681: UNESCO SCIENCE REPORT Table 24.4: P
- Page 682 and 683: UNESCO SCIENCE REPORT CONCLUSION A
- Page 684 and 685: UNESCO SCIENCE REPORT The governmen
- Page 686 and 687: UNESCO SCIENCE REPORT Figure 25.1:
- Page 688 and 689:
UNESCO SCIENCE REPORT Table 25.2: T
- Page 690 and 691:
UNESCO SCIENCE REPORT Figure 25.3:
- Page 692 and 693:
UNESCO Figure 25.6: SCIENCE Scienti
- Page 694 and 695:
UNESCO SCIENCE REPORT The volume of
- Page 696 and 697:
UNESCO SCIENCE REPORT of creativity
- Page 698 and 699:
UNESCO SCIENCE REPORT may not be ab
- Page 700 and 701:
UNESCO SCIENCE REPORT Accountabilit
- Page 702 and 703:
UNESCO SCIENCE REPORT 144 529 ringg
- Page 704 and 705:
UNESCO SCIENCE REPORT oversight wou
- Page 706 and 707:
UNESCO SCIENCE REPORT Figure 26.4:
- Page 708 and 709:
UNESCO SCIENCE REPORT Table 26.2: S
- Page 710 and 711:
Figure 26.7: Scientific publication
- Page 712 and 713:
UNESCO SCIENCE REPORT Figure 26.9:
- Page 714 and 715:
UNESCO SCIENCE REPORT exercises tar
- Page 716 and 717:
UNESCO SCIENCE REPORT A major chall
- Page 718 and 719:
UNESCO SCIENCE REPORT Figure 27.2:
- Page 720 and 721:
UNESCO Figure 27.4: SCIENCE REPORT
- Page 722 and 723:
UNESCO SCIENCE REPORT comparatively
- Page 724 and 725:
UNESCO Figure 27.5: SCIENCE Trends
- Page 726 and 727:
UNESCO SCIENCE REPORT Figure 27.6:
- Page 728 and 729:
UNESCO Figure 27.8: SCIENCE Scienti
- Page 730 and 731:
UNESCO Figure 27.8 SCIENCE (continu
- Page 732 and 733:
UNESCO SCIENCE REPORT although the
- Page 734 and 735:
UNESCO SCIENCE REPORT According to
- Page 736 and 737:
UNESCO SCIENCE REPORT the volume of
- Page 738 and 739:
UNESCO SCIENCE REPORT There are 161
- Page 740 and 741:
UNESCO SCIENCE REPORT The National
- Page 742 and 743:
UNESCO SCIENCE REPORT The governmen
- Page 744 and 745:
UNESCO SCIENCE REPORT Box 27.3: Inn
- Page 746 and 747:
UNESCO SCIENCE REPORT Ambitious pol
- Page 748 and 749:
UNESCO SCIENCE REPORT (22%), physic
- Page 750 and 751:
UNESCO SCIENCE REPORT Figure 27.11:
- Page 752 and 753:
UNESCO SCIENCE REPORT gender implic
- Page 754 and 755:
UNESCO SCIENCE REPORT REFERENCES AA
- Page 756 and 757:
UNESCO SCIENCE REPORT 2016 732
- Page 758 and 759:
UNESCO SCIENCE REPORT Annex 1: Comp
- Page 760 and 761:
UNESCO SCIENCE REPORT Central Asia
- Page 762 and 763:
UNESCO SCIENCE REPORT Annex 2: Glos
- Page 764 and 765:
UNESCO SCIENCE REPORT five-year age
- Page 766 and 767:
UNESCO SCIENCE REPORT 742
- Page 768 and 769:
Table S1: Socio-economic indicators
- Page 770 and 771:
Table S1: Socio-economic indicators
- Page 772 and 773:
Table S1: Socio-economic indicators
- Page 774 and 775:
Table S2: R&D expenditure by sector
- Page 776 and 777:
Table S2: R&D expenditure by sector
- Page 778 and 779:
Table S2: R&D expenditure by sector
- Page 780 and 781:
Table S3: R&D expenditure as a shar
- Page 782 and 783:
Table S3: R&D expenditure as a shar
- Page 784 and 785:
Table S4: Public expenditure on ter
- Page 786 and 787:
Table S5: Tertiary graduates in 200
- Page 788 and 789:
Table S5: Tertiary graduates in 200
- Page 790 and 791:
Table S5: Tertiary graduates in 200
- Page 792 and 793:
Table S6: Total researchers and res
- Page 794 and 795:
Table S6: Total researchers and res
- Page 796 and 797:
Table S6: Total researchers and res
- Page 798 and 799:
Table S7: Researchers by field of s
- Page 800 and 801:
Table S7: Researchers by field of s
- Page 802 and 803:
Table S8: Scientific publications b
- Page 804 and 805:
Table S9: Publications by major fie
- Page 806 and 807:
Table S9: Publications by major fie
- Page 808 and 809:
Table S9: Publications by major fie
- Page 810 and 811:
Table S10: Scientific publications
- Page 812 and 813:
Table S10: Scientific publications
- Page 814 and 815:
Table S10: Scientific publications
- Page 816 and 817:
Table S10: Scientific publications
- Page 818:
UNESCO SCIENCE REPORT Data obtained